
Forex Indicators
Indicator Tools For Trading Analysis Top 10 forex indicators for profit earning consistently
10 Different Types of Forex Indicators and How to use Them for Profit
Some people say that currency, or foreign exchange, trading can be challenging.
Well, they are right!
Success in the world of forex is often a combination of several things.
Many years ago, forex trading was mostly for the big players. Today, with technological advancements, it is possible to have retail investor accounts.
Most publications estimate that up to 90% of new traders do not succeed. There are many reasons why this happens, and this article is focused on correcting one of them.
Long-term profitability in forex is often a result of data-driven decisions. One way to ensure this is by applying technical analysis.
Technical analysis is a detailed analysis of statistical trends gathered from trading activity. It is a great way to evaluate investments and identify trading opportunities.
This article is for people who want to start trading, novice traders, and professionals.
You will learn:
- What technical indicators are
- The different types of forex indicators
- Pros and cons of each of the types
- Top forex indicators
- How to use forex indicators
- How to use multiple indicators
- The best forex trading platforms
- And much more!
Get comfortable as we explore the world of forex indicators.
What are forex technical indicators?
Many indicators give an overview of market conditions. They are a visual representation gotten by examining and analyzing short and long-term average price movements.
Also, forex indicators can help you get better trade results in real-time (especially if you prefer to trade online).
Many traders use indicators to understand how the market is performing and anticipate future changes. Indicators are a core aspect of any effective trading strategy. They are the bedrock of informed trading decisions and, subsequently, higher returns.
The currency trading market is largely unpredictable. Therefore, you must make calculated moves and improve your trading strategy.
Why are forex indicators important?
Most traders need to understand market volatility at all times and with indicators, they can stay abreast. Forex indicators constitute investment advice backed by data.
Indicators provide answers to some of the most critical questions that forex traders ask.
Questions like:
“Is the market overpriced?” or “Which levels are good entry points?” or “Which currency pairs are bound to be more valuable?“
Whether it is short-term, swing, or long-term investing, indicators provide helpful trading signals. Traders and investors can build positions and open a position or new trade with this information.
Many forex traders cannot perform a fundamental analysis of the market. If you fall under this category, you are exactly where you need to be; here.
With indicators, you can successfully trade and invest in various markets across the globe. You will gain access to the essential trader signals and analysis.
Furthermore, indicators help investors to understand and analyze market trends. They help you predict uptrends, downtrends, and sideways moves.
Timing plays a crucial role in forex trading, and you need to accurately predict the right time to enter a trade. Many traders work with the help of forex technical indicators such as chart patterns, candlesticks, moving averages, etc.
These indicators help you to identify key limit levels and close trades that are going the wrong way. They also provide early signals about the movement of market makers and their activities.
Similarly, they also help traders to predict a market reversal.
Compared to fundamental analysis, forex indicators provide you with loads of information at a less expensive price. The latter also provides quicker chart results and prevents you from losing money rapidly.
Key Takeaway: Forex indicators are like an open book, a map that can help you make great gains. However, there are also times when they can cause significant losses. Indicators do not necessarily guarantee gains.
What are the different indicators in Forex?
The main factor that influences your choice of which indicator to use is your trading goals. However., it is easier to decide the best type of forex indicator for you when you understand the differences and similarities.
For the purpose of this article, we will categorize indicators into 3 broad groups:
LEADING INDICATORS
A leading indicator uses past price data to forecast future movement in prices in the market. Traders can get an early warning and understand the direction of the trade before a new trend starts.
One of the downsides of leading indicators is that they are sometimes misleading (infamous cases of many false signals). The leading indicator is not always correct; you may experience fakeouts.
Leading indicators are not perfect; however, you can get great benefits when you use them appropriately in the context of a trend framework.
Examples of leading indicators include:
- Fibonacci replacements
- Support and resistance levels
- Ichimoku indicator
Ichimoku Indicator
Developed by Goichi Hosoda, the Ichimoku indicator measures and predicts price movement. It is a trend-following system with an indicator similar to moving averages.

Pros
- Predicts price movement and provides favorable entry points for a possible move
- Offers dynamic support and resistance levels
- It is a great way to measure the direction and intensity of market trends
Cons
- Due to the advanced technical analysis, leading indicators may be difficult for new traders.
- The forecasted price action is not guaranteed. Therefore, traders may need to apply their own knowledge of indicators in every situation.
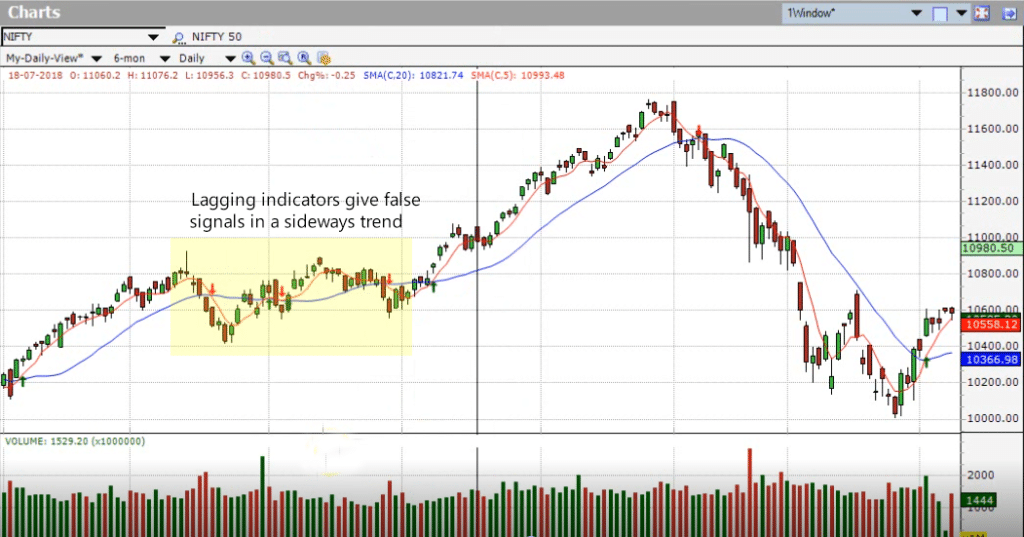
LAGGING INDICATORS
With a lagging indicator, you can use the average of the previous price action data to analyze the markets.
Most times, there is a lot of market noise, and this distracts buyers. A lagging indicator gives you a signal that a trend has started based on previous closing prices.
They are most efficient in cases where prices move in relatively long trends.
A price chart is not the only factor to consider when looking for market signals. Other lagging indicators can be very helpful. They help you to get a better idea of the market trend.
However, in most cases, you enter the position late.
Examples of lagging indicators include:
- Moving Average Convergence Divergence (MACD)
- Simple Moving Average (SMA)
- Relative Strength Index (RSI)
Pros
- Lagging indicators reduces the high risk of failed moves or false breakouts
Cons
- Traders sacrifice potential pips by waiting for a go-ahead from the lagging indicator.
- Lagging indicators don’t warn you of upcoming changes in prices. They simply tell you how the prices are rising or falling so that you can trade accordingly.
CONFIRMING INDICATORS
When it comes to trading, there is no such thing as “too sure”. This is why we have to confirm the analysis of technical indicators. These kinds of indicators are extremely useful for validating price analysis.
In cases where you use several indicators to create an analysis, you need to validate your price.
An example of a confirming indicator is the On Balance Volume- OBV. The OBV readings focus on what drives the trend. This is a great way to understand and rightly predict whether the market is moving in an uptrend or in a downtrend.
Suppose, for whatever reasons, you conclude that an uptrend will reverse. In that case, you can use the OBV indicator to confirm your analysis.
Other types of forex indicators
Apart from the above, FX technical indicators can be further arranged based on the data extracted from them.
There are endless different indicators that you can use to get trade signals.
TREND INDICATORS (Moving Averages, Parabolic SAR, MACD)
Trend indicators are some of the most important forex indicators. Forex traders often argue that you should only trade with the trend. A trend indicator will help you to identify a trend. This makes it easy for you to decide at which level to enter the trade.
VOLATILITY INDICATORS (Bollinger Bands, Envelopes, ATR)
Using ranges, these indicators show the behavior of the price and volume behind any movements. They are important because dramatic changes in behavior can provide a good entry signal.
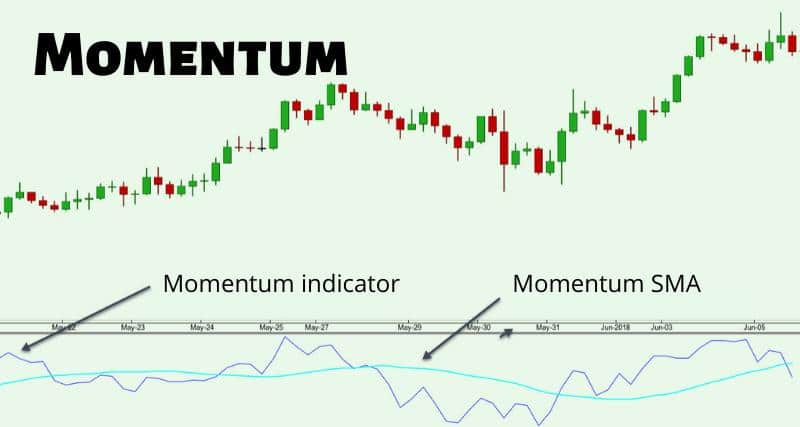
MOMENTUM INDICATORS (RSI, Stochastic, CCI)
Momentum indicators are useful to determine overbought or oversold positions. These types of indicators provide the best signals of new trends. As the name suggests, a momentum indicator shows the momentum with which price movements happen in the market.
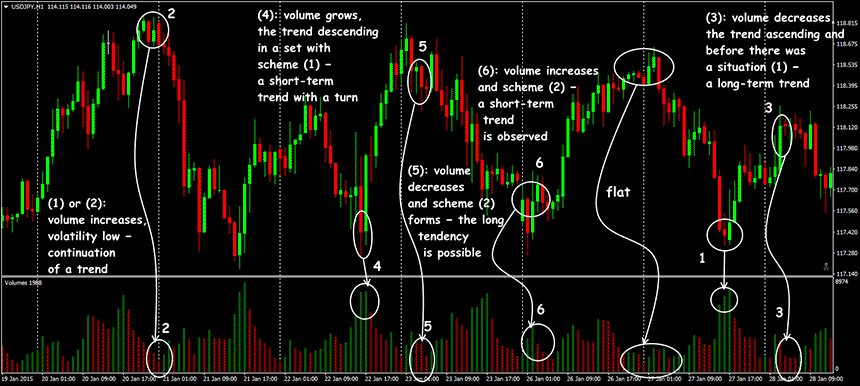
FOREX VOLUME INDICATORS
These types of indicators show the volume of trades behind a price movement. They follow the principle of evaluating the general amounts of financial instruments being traded within a time frame. This data is visualized on the chart for the trader to understand how the market is performing.
They help you differentiate between price movements with higher volumes (strong signal) from lower volumes (low signal).
CUSTOM INDICATORS
Earlier in the article, we mentioned how it is preferable to combine indicators. With custom indicators, you can modify parameters freely within charts, Based on your trading goals.
Generally, custom indicators are created using simple algorithms with existing variables. Some systems for custom indicators require coding, while others provide a set user interface that eliminates the need for coding.
You can create custom indicators based on your trading goals. They can be used to create alerts when market movements trigger a trend or a price reaches certain levels. This helps you keep an eye on the market. Some commonly used platforms include; MetaTrader 4 or MetaTrader 5.
Key Takeaway: There are no perfect indicators. Forex indicators guide traders and help them discover likely outcomes. While leading indicators perform best in sideways markets, lagging indicators are great for trending markets. This is not to say that you have to exclusively use one or the other. However, you can combine both effectively when you understand the potential pitfalls of each.
Let’s take a look at some other forex technical indicators:
OSCILLATORS
Oscillators are the proper foundation to evaluate currency pairs. As the name suggests, the indicators oscillate between fixed values in relation to the actual asset price.
With the data obtained from this, professional traders can predict future price movements. It also helps you gauge the strength or momentum of the directional movement.
Oscillators differ based on their respective uses. While some were made to identify good trading opportunities, others were made to interpret trending markets.
Knowing the best indicators to use for what circumstances will make a world of difference. It is one of the key things that differentiates successful traders from unsuccessful ones.
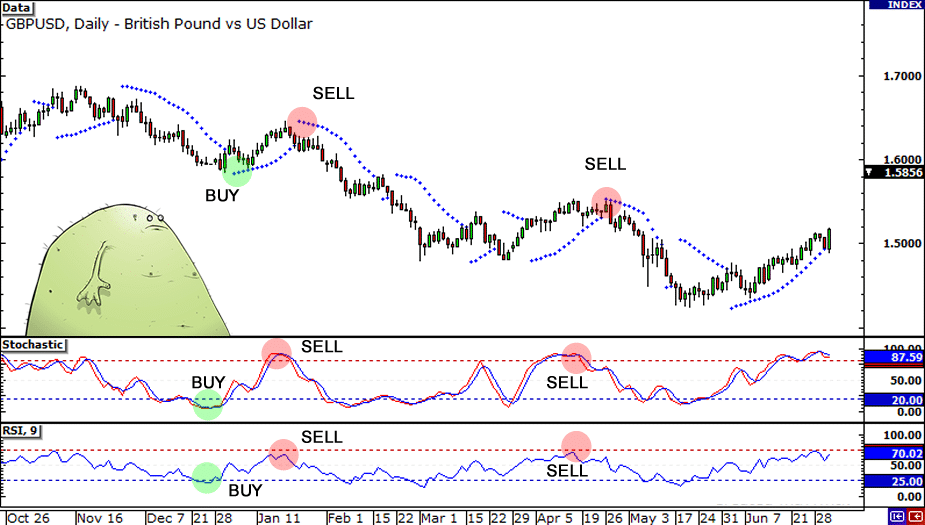
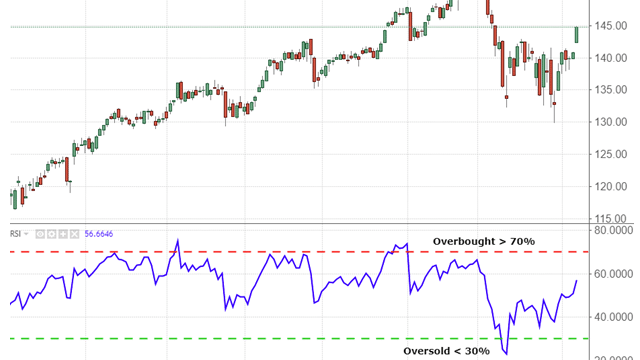
An example of a popular oscillator is the Relative Strength Index (RSI).
The RSI indicator measures the extent of recent price changes and determines overbought and oversold conditions. Developed by Welles Wilder Jr., today, the RSI indicator is one of the most trusted oscillators.
BOLLINGER BANDS
Bollinger bands are designed to measure the pricing volatility of securities. They were introduced in 1893 by John Bollinger.
BBs are not intended to define market entry/exit points. Rather, they provide a detailed look at volatility, and they exist as a set of moving averages.
Traders of currencies often look for incremental price moves. This is easier when traders quickly recognize high-level volatility and trend changes.
The main purpose of this indicator is to help traders stabilize market prices. It also helps them determine whether assets are priced reasonably and when the price reaches a lower or upper limit.
These details help investors to determine whether they are paying a fair price for the asset or not. This technical indicator features the upper band, midpoint, and lower band. Each of these is represented by a signal line on the pricing chart. Traders often use them to discern the market state.
The upper and the lower bands are based on a standard deviation of the price from the moving average. Bollinger bands adjust themselves to market conditions by measuring volatility.
Although BBs are trademarked, they are available to the public. They are also not recommended as an exclusive method to understand price movement. However, forex traders can combine them with other tools.
Pros
- BBs provide an in-depth overview of the trend.
- With the squeeze signal, BBs raise trading opportunities for traders.
Cons
- The bands never truly depict changes in the trading environment; the process revolves largely around the guesswork.
- They do not predict the outcome; they only react to ongoing trading matters.
Key Takeaway: When outlining his Methods, John Bollinger recommended that traders use a 20-day moving price average to analyze markets. Although technical indicators have their downsides, the Bollinger brands have become such a useful tool in identifying extreme short-term prices in a security. Prices are considered overbought when stock prices continually touch the upper band. Conversely, when prices reach the lower band, they are oversold and would trigger a buy signal.
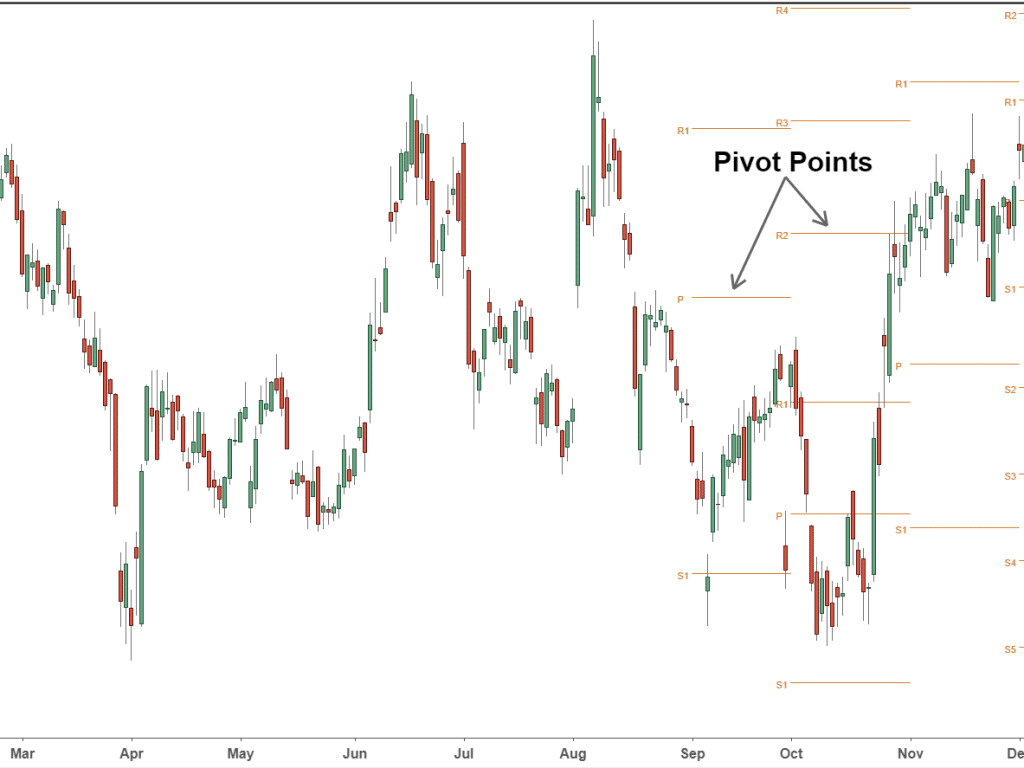
PIVOT POINTS
A pivot point refers to the price at which the direction of the price movement changes. It is calculated by analyzing the high, low, and close of the previous trading day.
The data gotten from this technical indicator represent the intraday point of balance between buyers and sellers. This helps you to recognize where most of the trades are taking place.
Pivot points serve as indicators used by floor traders to determine directional movement (pivots) in the commodities market.
They became popular when traders of the floor exchanges began to use them. They are used to determine when market sentiment changes from bullish to bearish or vice versa.
They are mostly regarded as an accurate leading indicator. This is because most participants in the commodities market are watching and trading those key levels.
In cases where the price exceeds certain levels of support or resistance, it affects the rest of the trading day.
You can access free pivot point calculators from several third-party websites and retail forex brokers.
Pros
- Pivot points remain one of the most reliable leading indicators in forex trading
- They work well in liquid markets
- They offer excellent support/resistance levels
- A significant number of market participants watch and trade with pivots
Cons
- For best entries, it needs to be complemented by other technical indicators
- Offers false signals during non-trading days
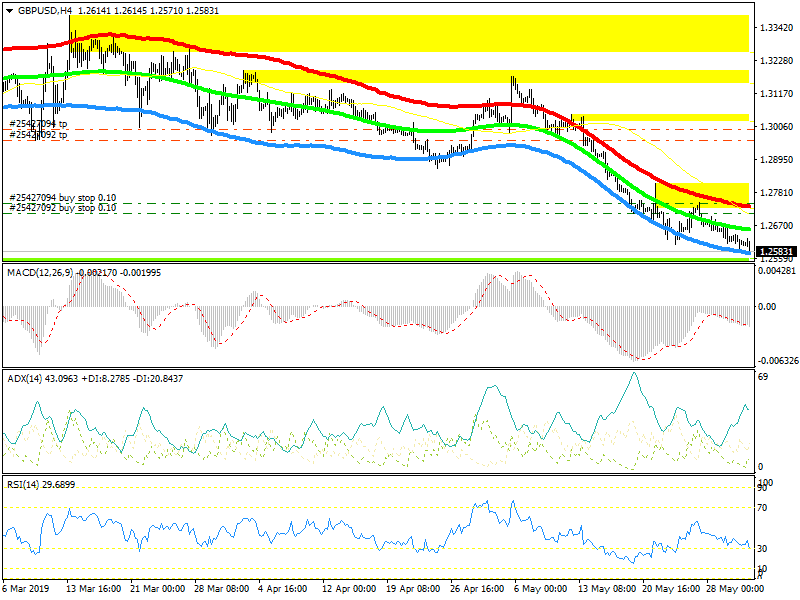
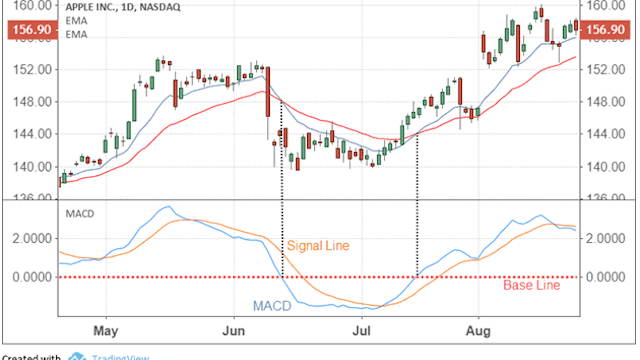
MOVING AVERAGE CONVERGENCE/DIVERGENCE (MACD)
The Moving Average Convergence/Divergence is used to evaluate the swift price changes. It is a popular tool used to understand the momentum behind a breakout. This understanding can help traders to spot likely breakouts before the price touches the signal line of resistance.
The MACD indicator uses a histogram to better understand market conditions. Apart from spotting breakouts, it can also help traders determine when to close their position.
Prices may reverse when momentum is slow; however, with the MACD indicator, traders can be on alert. Based on the momentum of price changes, traders can maximize earnings.
Pros
- With multiple data points, the MACD is a more expansive technical indicator than several alternatives.
- It is possible to customize MACD on shorter timelines.
- In cases where the default calculations are too broad to be consistently relevant, you can improve the value of MACD.
Cons
- Accuracy may be reduced during highly volatile conditions.
RELATIVE STRENGTH INDEX
The RSI is one of the best forex indicator tools for evaluating potential forex breakout. It uses a 100-point scale to analyze purchasing trends.
It has become a relevant way of measuring and determining whether conditions for currency pairs are overbought or oversold.
In most cases, overbought or oversold conditions point to potential price reversals and potential reversal breakouts. You are more likely to see a market correction when the RSI is closer to either extreme.
For example, a forex pair is considered to be oversold when the RSI dips below 30. This can signal a potential increase in the demand for that pair and eventually lead to a price breakout.
Pros
- RSI is a highly straightforward indicator
- It naturally complements several indicators, such as the MACD. The RSI is seen as a great indicator to pair with.
- The RSI is proven to work not only in forex but in other markets.
Cons
- There are cases where the RSI provides false indications because data used to calculate it can lag in a trending market.
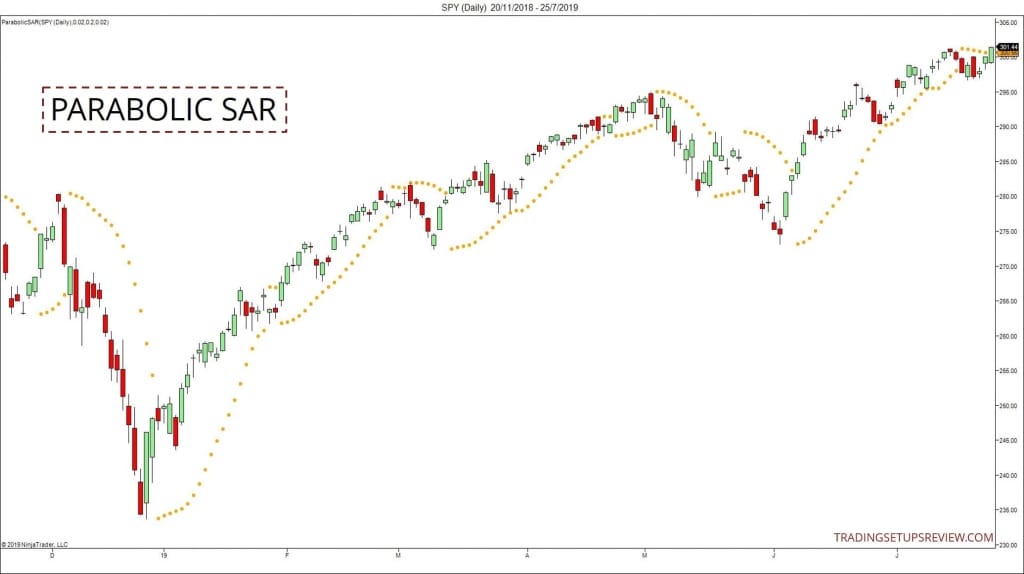
PARABOLIC SAR
The PSAR is constructed by placing a dot above or below a prevailing trend on the pricing chart. This technical indicator examines a security’s momentum and provides valuable information to traders.
Like other oscillators, the Parabolic Stop And Reverse (PSAR) attempts to establish whether a market is overbought or oversold.
Designed by J Welles Wilder Jr., it is used to identify trend direction and potential reversal points. However, it does not use any kind of standardized scale. Rather, it uses a series of strategically placed ‘dots.’
For uptrends, dots are placed below the price, while dots are placed above for downtrends. The PSAR helps traders to project the end of a trend.
This technical indicator uses recent extreme price (EP) data and an acceleration factor (AF) to determine where dots appear.
Pros
- The dots can be interpreted straightforwardly
- With the PSAR, you can leverage trend reversals
- It can be used to determine support and resistance levels
- It performs well in a trending market
- It is one of the known complementing technical indicators
Cons
- The PSAR does not provide good signals during sideways market conditions
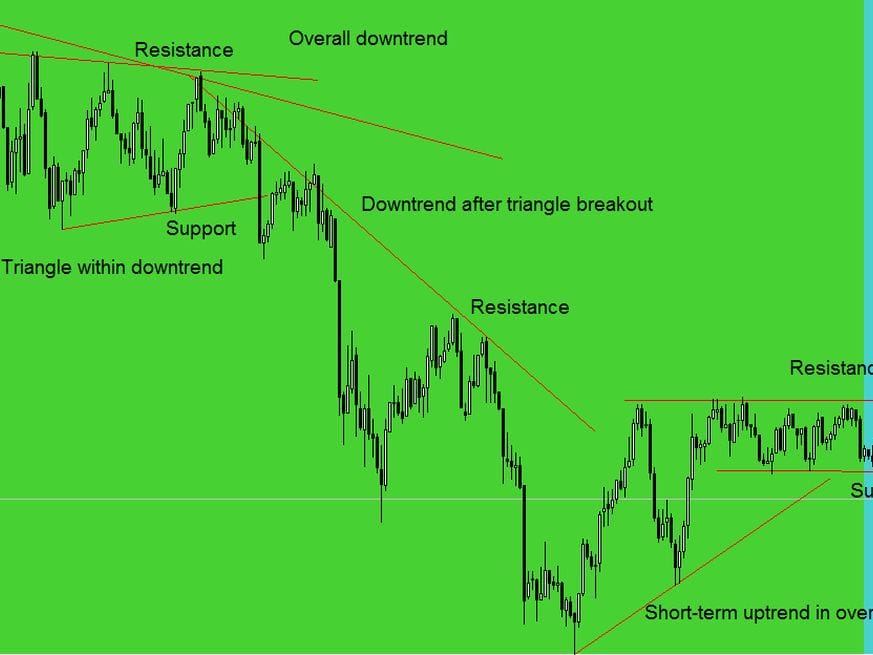
SUPPORT AND RESISTANCE LEVELS
In simple terms, support levels refer to a price that a currency pair will not likely fall below. In contrast, resistance levels refer to the price that the currency pair will likely never exceed.
This is another tool that provides forex traders with valuable insights. It looks into the supply and demand of a security/currency pair to understand why things happen.
Support and resistance levels are a crucial element of technical analysis. They help investors understand what is going on in the markets.
The data obtained from analyzing key levels can predict whether a current trend will keep going or reverse.
A currency reaches a support level because a drop in value has caused more buyers than sellers. Conversely, a currency hits a resistance level after a sharp price increase.
However, it is important to note that support and resistance levels are not always confirmed. Human psychology is a major driving factor for the forex market. Therefore, global markets will regularly experience psychologically significant levels of support and resistance.
E.g., a currency may break past resistance and the price action still attracts the interests of many investors and subsequently raise the price. However, other participants of the market may sit back and wait for the currency to lose value. The latter’s decision to hold back could become a new source of support.
Pros
- Helps investors to identify ranges in currency trades
- The use of price action trading will greatly influence your trade entry
- This indicator presents a great risk to reward ratio (for trades that work)
- It is a great way to manage risks in the market
Cons
- There may be false breaks
Key takeaway: it is important to understand that each indicator has its unique function. For the best trading results, you need to avoid redundancy. This is a case where you mix two indicators with the same signal and this leads to double signals.
Lastly, note that market signals aren’t stronger just because two or more different indicators confirm one another.
How to use forex indicators?
The forex market is driven by humans, and human nature does not change. Therefore, when you pay attention, you can spot patterns and use them to your advantage.
With indicators, you can organize and categorize these patterns. Subsequently, you can gain insights and create successful trading strategies.
Indicators are best maximized when they are combined. With thousands of different options on the market, traders must narrow down options and make a choice.
Technical indicators are computerized calculations that are used to forecast price changes in financial markets. With the kind of data that indicators provide, traders can confidently go into trades.
Different technical indicators offer different options. Therefore, your choice of indicators is critical to how effective they are.
TIPS FOR FOREX TRADERS
- A Forex Indicator is best combined with more subjective forms of technical analysis. This way traders can get real-time buy and sell signals Given their quantitative nature, they can also be incorporated into automated trading systems.
- With hundreds of indicators in the market today, it is hard to understand them all. It is recommended that you use 2 (or at most 3) indicators per trade.
- A higher number of indicators does not guarantee success in trading forex.
- To get the most of the indicators, combine technical analysis with fundamental analysis.
- Patience is an important virtue when it comes to trading forex. Some indicators require more time before their predictions happen.
- Each forex indicator comes with default values. It is best to adjust these values to suit your trading pattern.
Key Takeaway: As a trader, you need to understand currencies and how they peak in different markets. Indicators provide insights into this, by using the right indicators, you can safely make assumptions. To determine the right currency pair, you also need to get the daily average price range.
Which are the most accurate and popular forex indicators?
Forex markets present a great opportunity to build wealth. However, it can also be an uncertain territory to explore. With reliable forex indicators, the journey is somewhat easier.
You don’t have to be an expert to get the most from forex trading. With reliable, trustworthy, and verified forex signal providers, you can get insightful trade signals.
Today, there are countless forex signal providers all promising to provide excellent services. It is difficult to spot the fakes; however, we have made it easier.
We compiled a list of the best forex indicators.
Check out the following if you are looking to explore the world of indicators as a trading strategy.
- Elliott Wave Forecast: This is one of the largest technical analysis companies in the world. They offer a range of asset groups such as forex, commodities, cryptocurrency, stocks, etc.
- Learn 2 Trade: This platform provides forex signals, marketing analysis, forex trading recommendations, and many more in real-time.
- MQL5: This platform is unique and highly diversified. It places a lot of emphasis on performance to create trading signals.
- Forex signal factory: Although this platform is not as popular as most forex trading platforms, it is one of the best free forex signal providers on the market today. It is a great option for beginners.
- FX Leaders: This platform adopts various trading strategies to ensure trader success. It offers both free and premium services to users.
- WeTalkTrade: This platform is increasing in popularity through its top-notch application services. Their app is compatible with IOS and android, and it offers you real-time insights.
- ForexGDP: Known as one of the top forex signals providers, ForexGDP offers trader alerts with a trading system offering targeted gains of 300-1500 pips per month.
New forex indicators
If you are new to forex, these are some of the best forex indicators for beginners:
- Forex Olympus
- Trendy master
- FX atom pro
- Fibo Quantum
- X scalper 70
- Infinity Scalper
- Fxenigma
Key Takeaway: Before choosing what indicators to use, you need to understand the categorization of indicators. This categorization helps you to use indicators that complement one another. Also, note that some indicators can be multifunctional and can be used under different circumstances.
Conclusion
With far more activity than the stock market itself, the forex market is one of the most popular trading markets in the world.
The market is dynamic, and it moves according to the laws of demand and supply. Every day, millions of traders try to take advantage of the slight changes in exchange rates, either through trading CFDs or other assets.
This article has gone through some of the best forex indicators on the market today. Forex indicators help traders visualize how demand and supply moves. Furthermore, indicators help them to filter the ever noisy market and understand market behaviour
In most cases, it is assumed that upward market movement means more buyers than sellers and vice versa.
There are times when this logic is incorrect, and this is when we turn to indicators. They are every trader’s tool to spot loopholes and use trading signals to your advantage.
The goal of this article was to succinctly cover all there is to know about forex indicators. No matter how challenging forex can be, with indicators, you can reduce the risks of losses.
It is hard to decide what the best trading indicator is, however, you can find the ones that work best for you.
Hope this article has been helpful?
Let us know which is your favourite forex indicators and why in the comments below.
Thank you for reading.
Free Forex MT4 and MT5 Indicators – ForexRacer
Official MetaQuotes Indicators Market (Free & Paid) – MQL5.com
FAQs
The truth is that there is no such thing as a “best technical indicator” or “the best combination of indicators”. Anyone that is telling you this is probably an overzealous marketer. To determine the best indicator for you, consider your trading style and trading experience.
It depends on the type of signal you are hoping to get and what kind of market you are looking at. For example, a combination of MA + RSI + Pivot point works well for swing trading in trading markets. While ATR + Donchian channel is more applicable to low volatility markets.
Every indicator has its unique benefits. Success with indicators depends on the trader and the market conditions involved. However, three of the most underrated indicators include:
- the Average true range indicator (ATR)
- the relative strength index (RSI)
- the exponential moving average (EMA)
Forex is a range-bound market and it is also decentralized. Therefore, there is no method or formula for keeping track of contracts as it is in the financial market. Forex traders don’t care about how many contracts are sold, they care about the price action and a number of other things. Instead of forex volume indicators, many traders use the tick volume and their market experience.
Yes they do, they help identify buy and sell signals and make certain predictions about the currency market behaviour. They can also help in filtering general market commentary.
The moving average is one of the best ways to tell whether a market is trending or ranging.