Trading Results
Check the Forex fundamental and technical analysis for buying and selling of each signals in fx market which helps you to understand why our analyst has given the Buy signals and Sell Signals. Please note : It is better to sit quiet instead of taking wrong trades, we focus on providing you the forex signals only at good trade setup. If you want to test our forex signals, click here to try our free signals. Enjoy watching the best trade setups in forex market. Join Free.
-
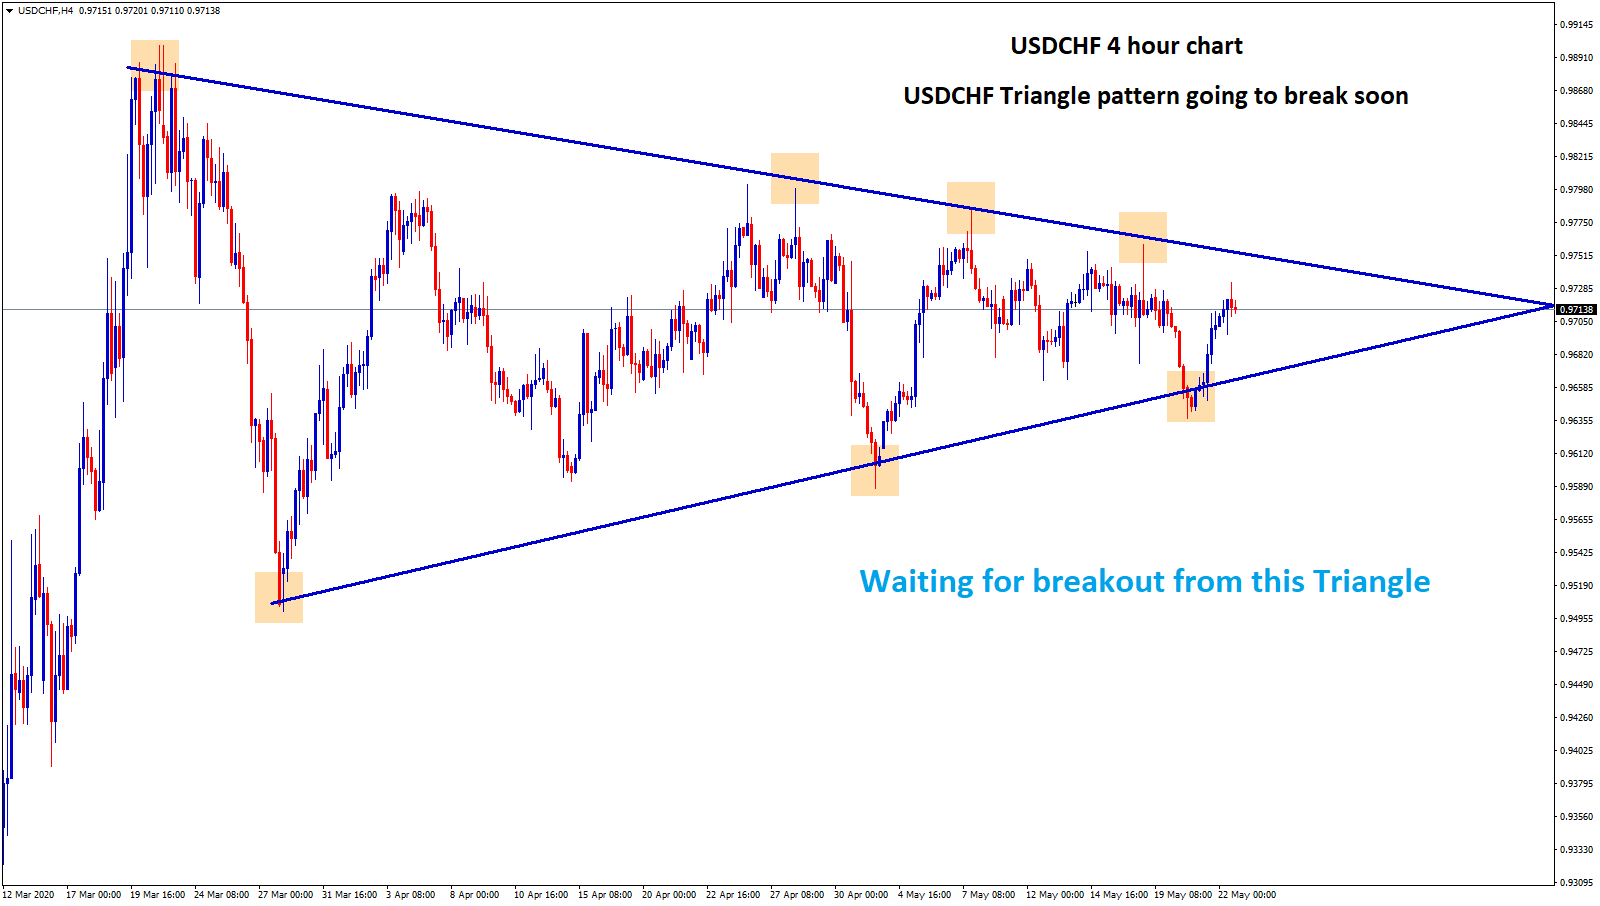
USDCHF Triangle going to break soon

USDCHF Triangle chart pattern in four hour time frame USDCHF is moving up and down between the Triangle price range…
-
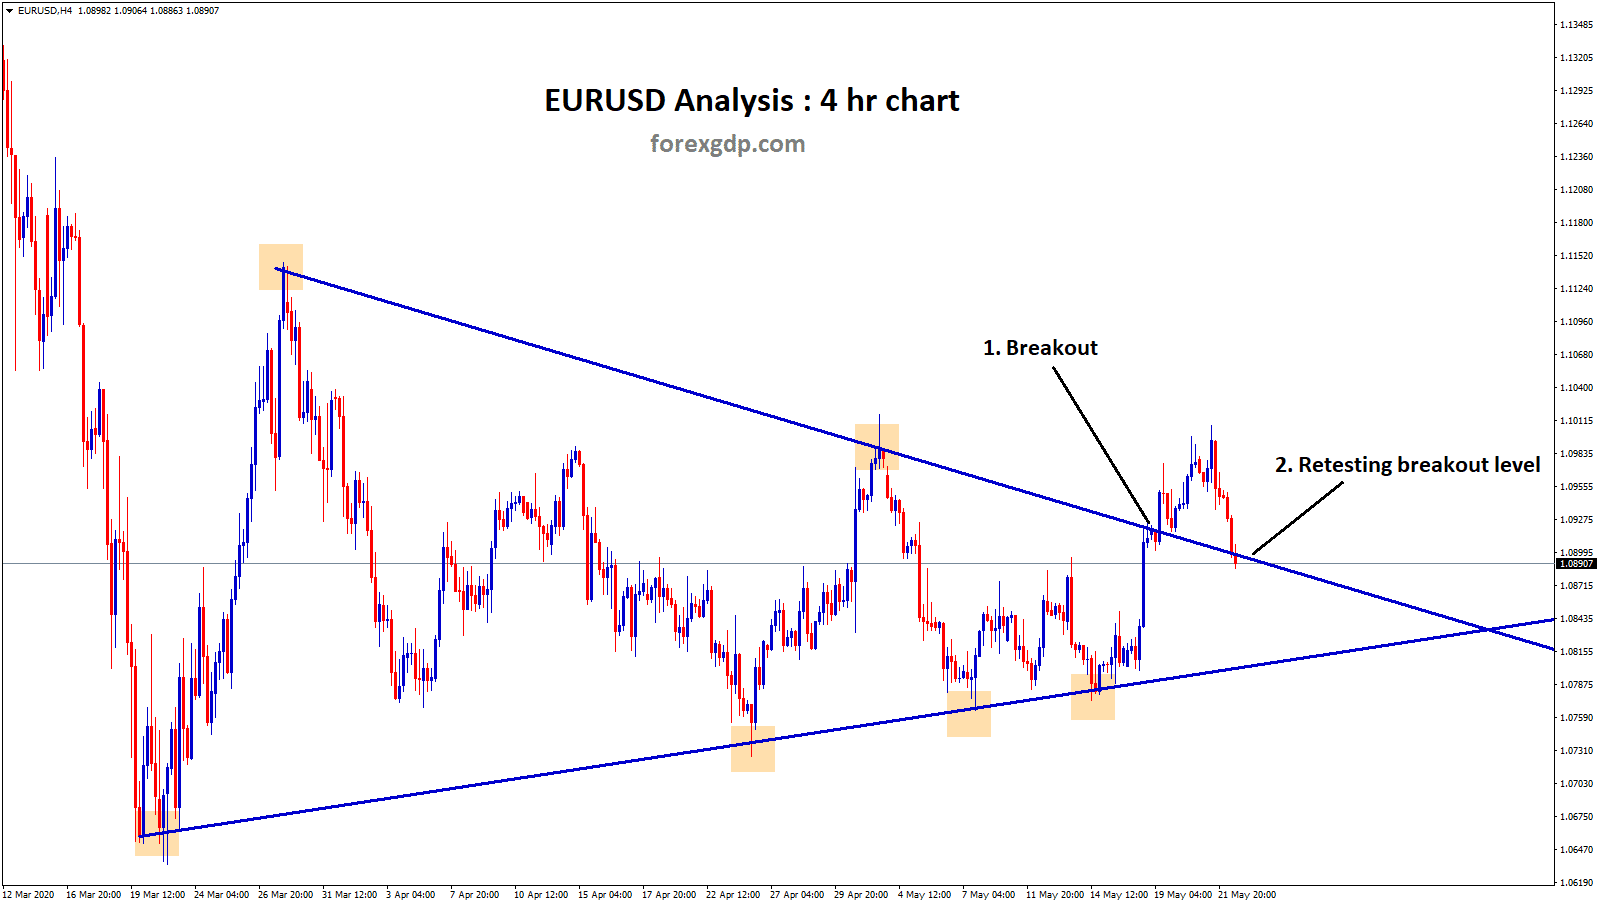
EURUSD retesting the Triangle breakout and CADJPY hits Trendline Support
Forex Market Analysis for Education Purpose EURUSD retesting the Triangle breakout level EURUSD broken the top level of the Symmetrical…
-
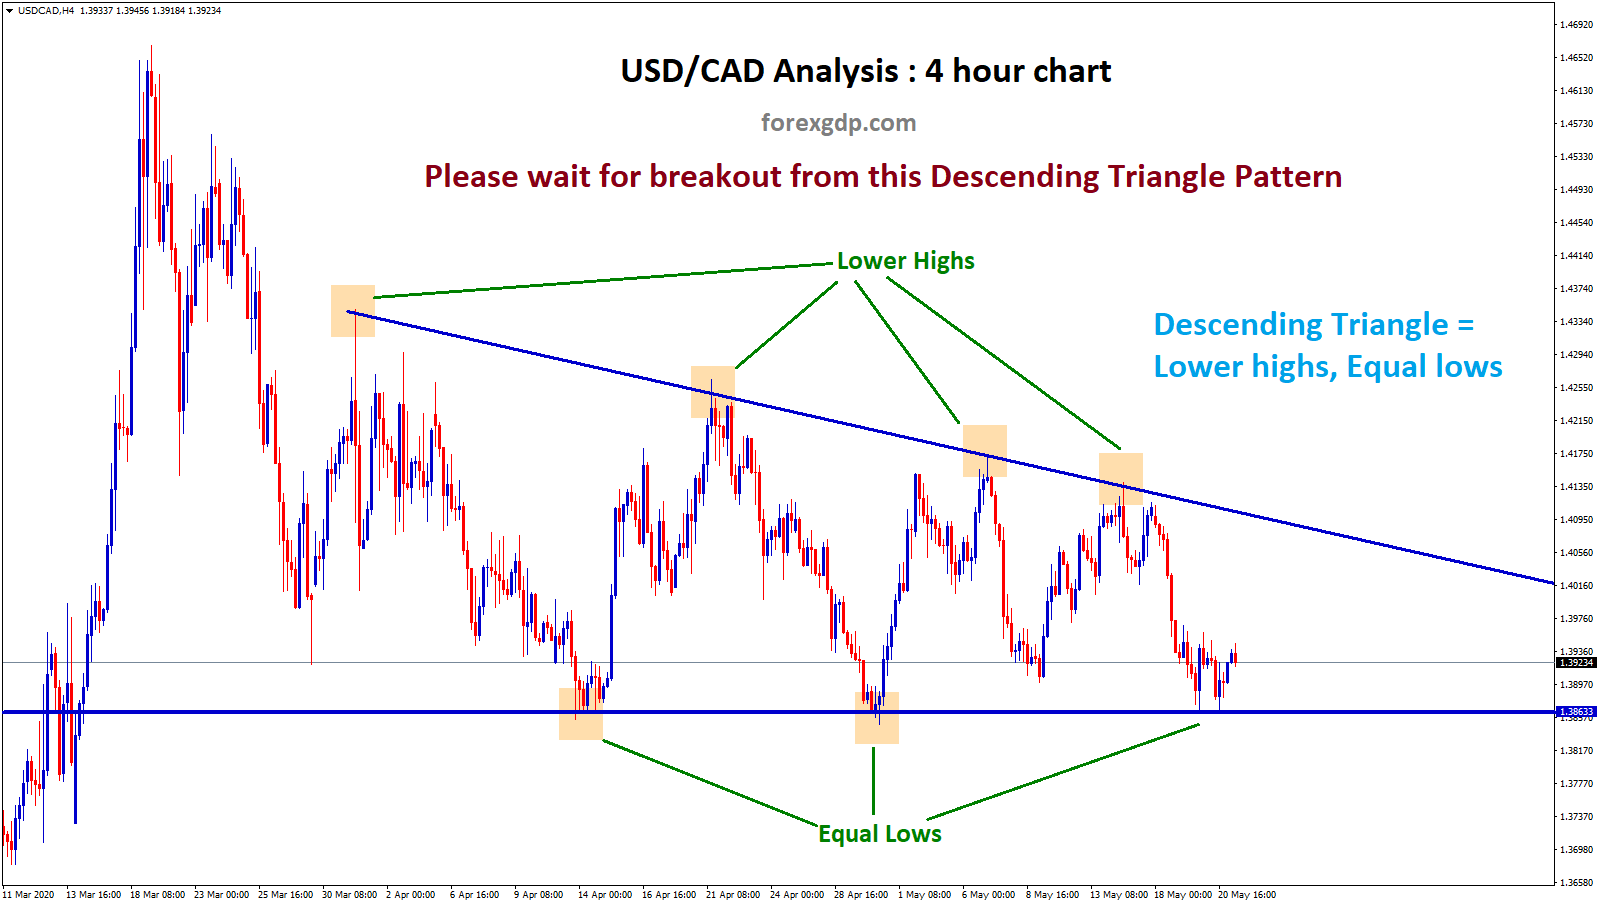
Descending Triangle pattern in USDCAD. Wait for breakout.
USDCAD Descending Triangle chart pattern USDCAD creates a chart structure with lower highs and equal lows. it's moving in a…
-
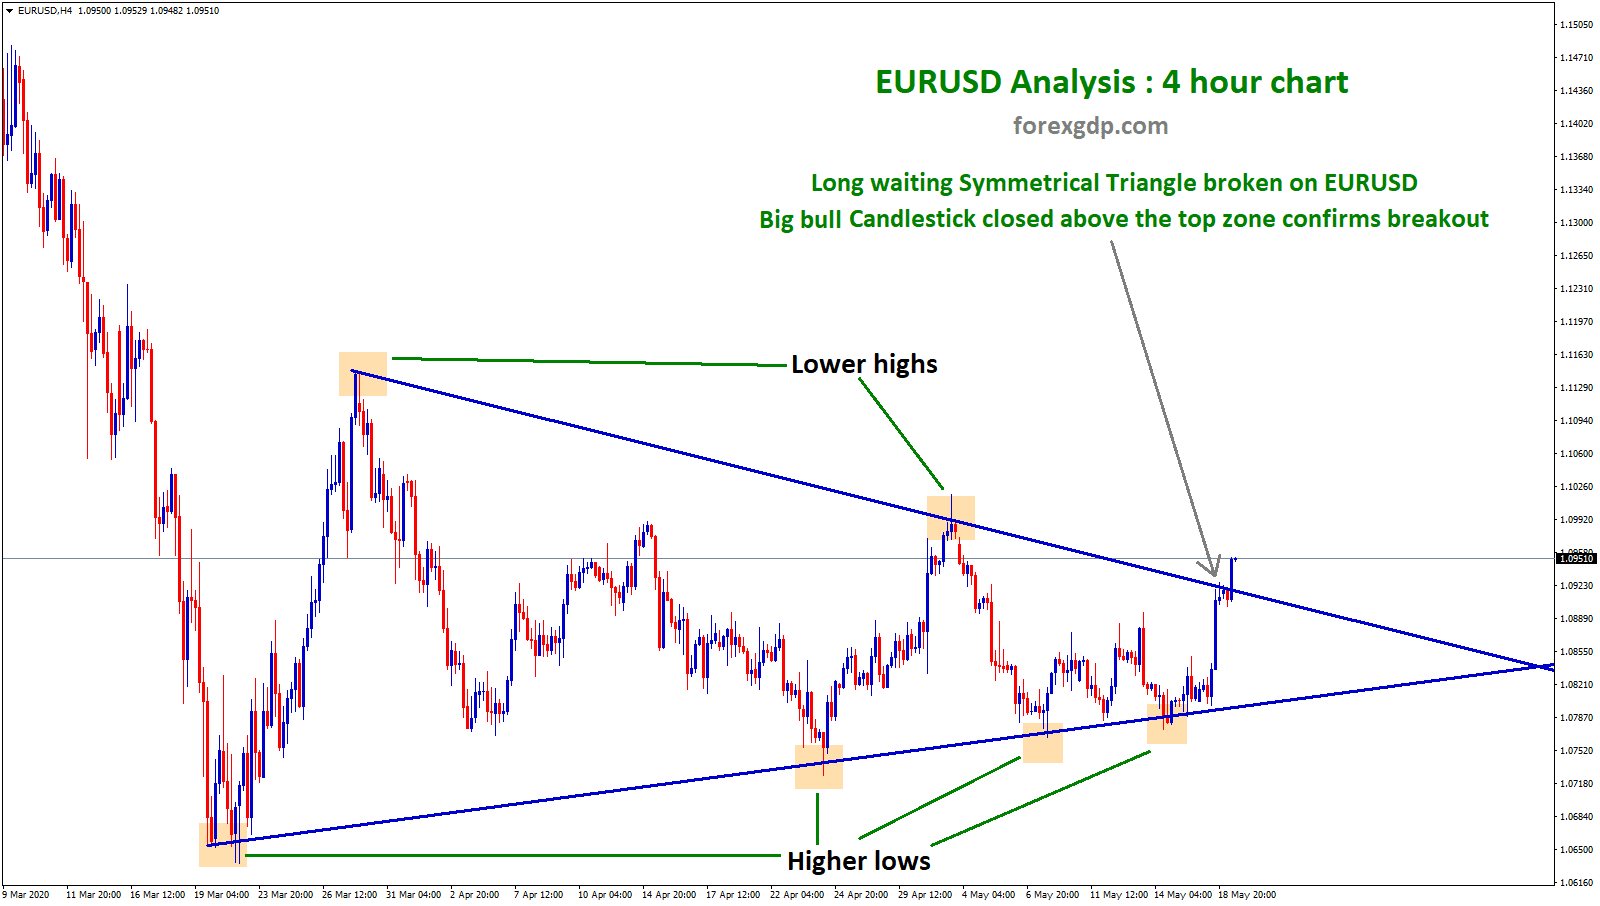
Symmetrical Triangle Pattern on EURUSD USDCHF
Symmetrical Triangle broken on EURUSD, waiting on USDCHF Lower Highs, Higher Lows creates a Symmetrical Triangle Pattern. Symmetrical Triangle pattern…
-
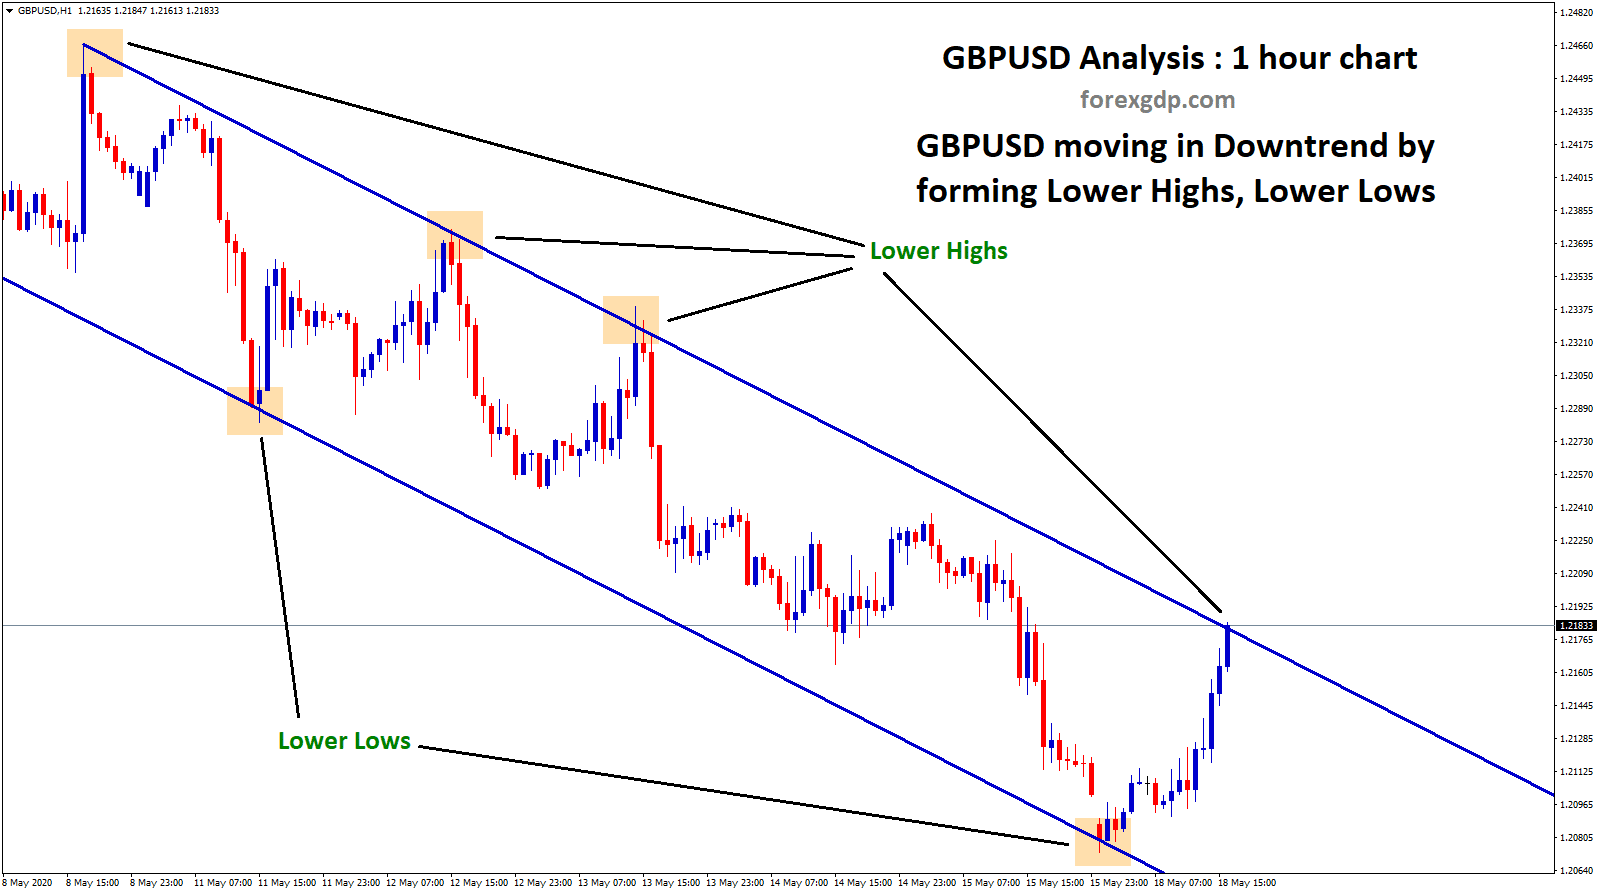
GBPUSD moving in downtrend

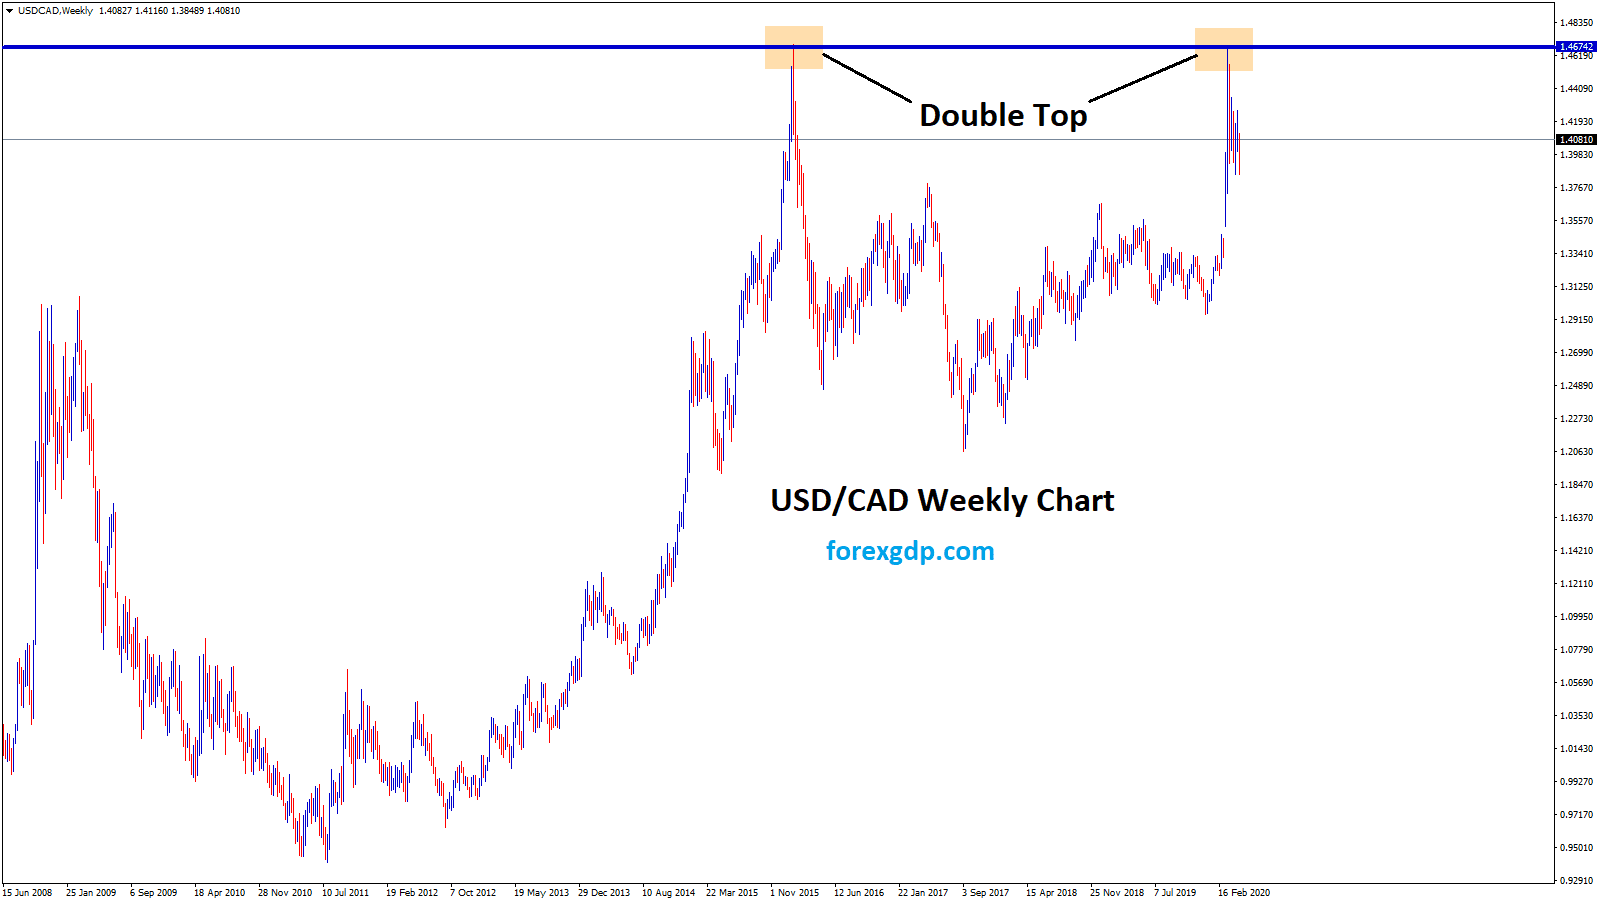
GBPUSD Double Top Chart Analysis GBPUSD formed a double top in 4 hour chart. Recently, market broken the bottom zone.…
-
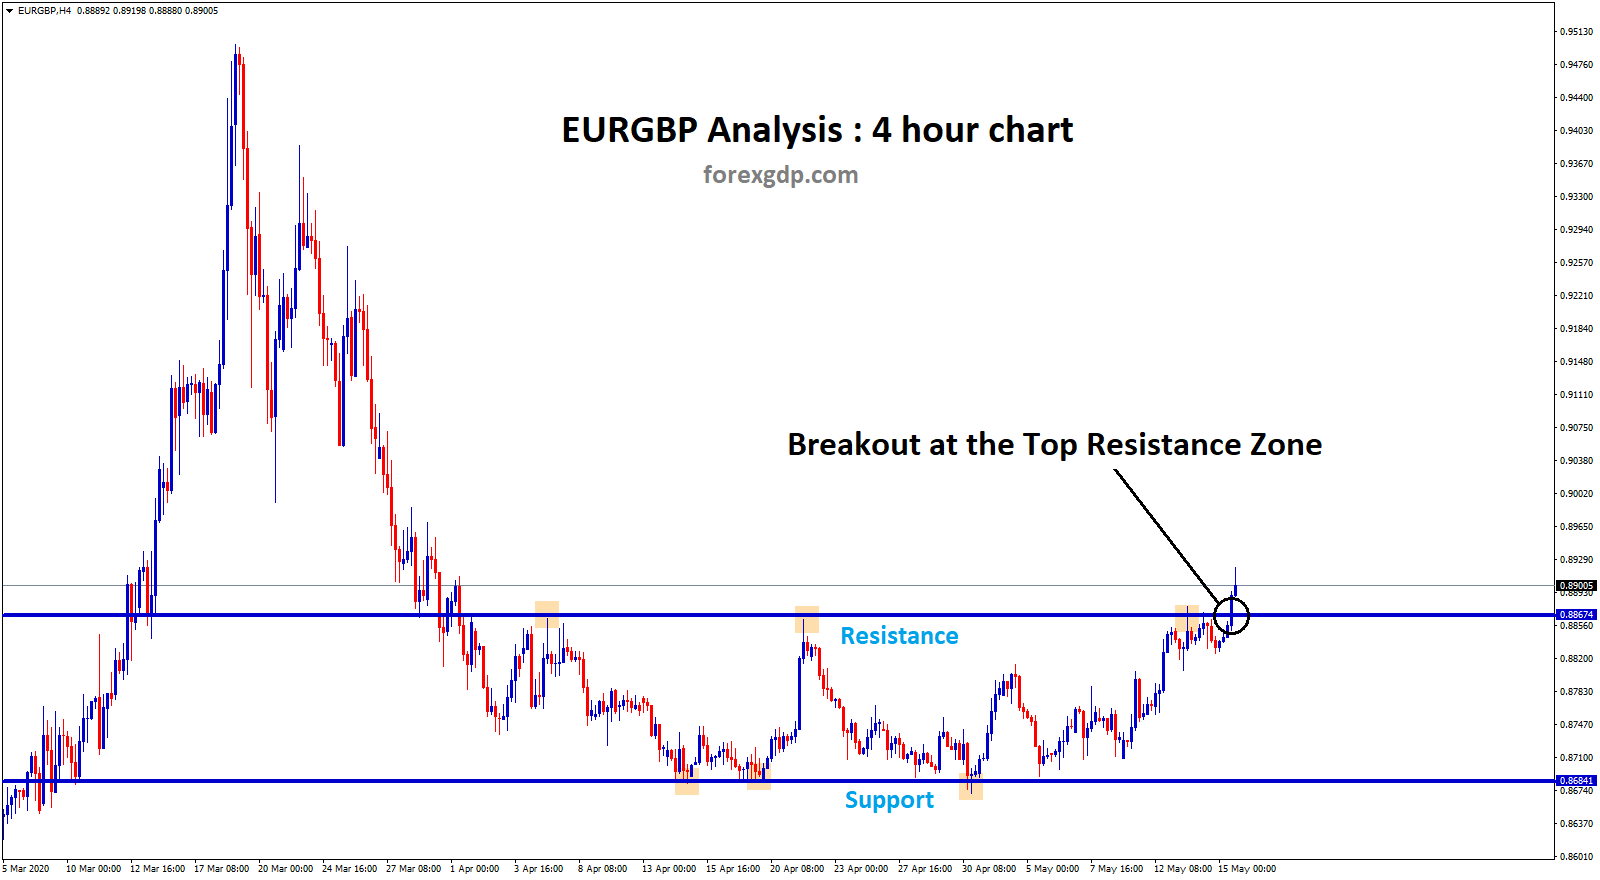
EURGBP Resistance Zone broken after 45 days!

EURGBP Support and Resistance Analysis EURGBP moved up and down between the Resistance and Support Zone in 4 hour chart.…
-
USDCAD soared +229 pips in last 24 hours

USDCAD Price forecast from the support Before 24 hours, we have updated that "USDCAD landed in the support zone" check…
-
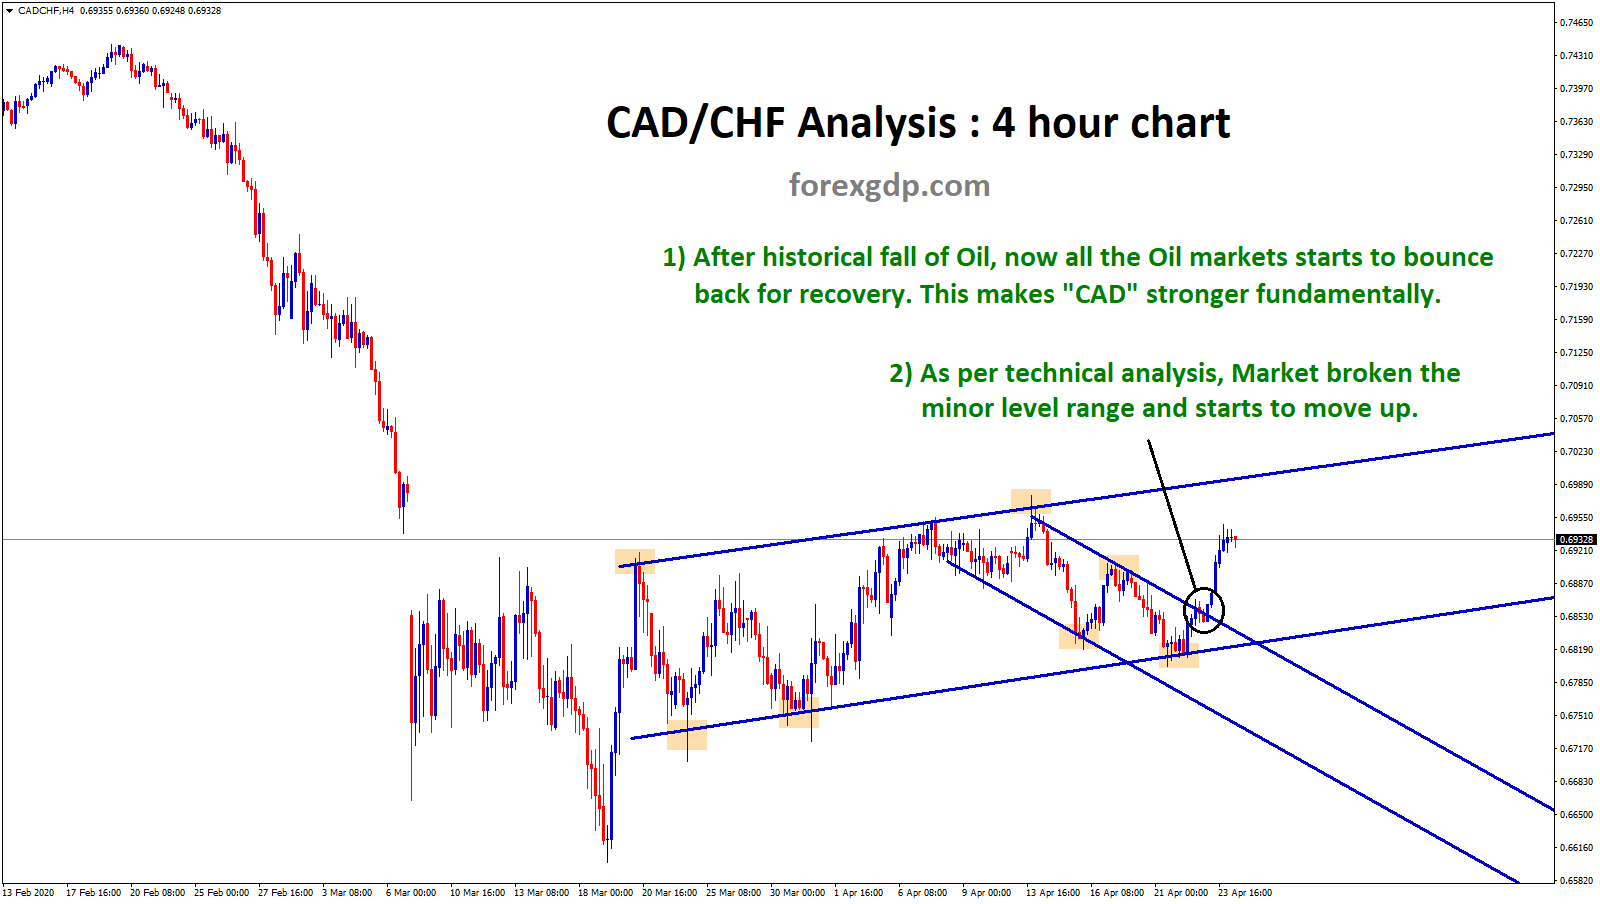
CAD currency getting strong due to crude oil recovery
CAD Currency correlation analysis with Crude Oil markets After historical fall of Oil, now all the Crude oil markets starts…
-
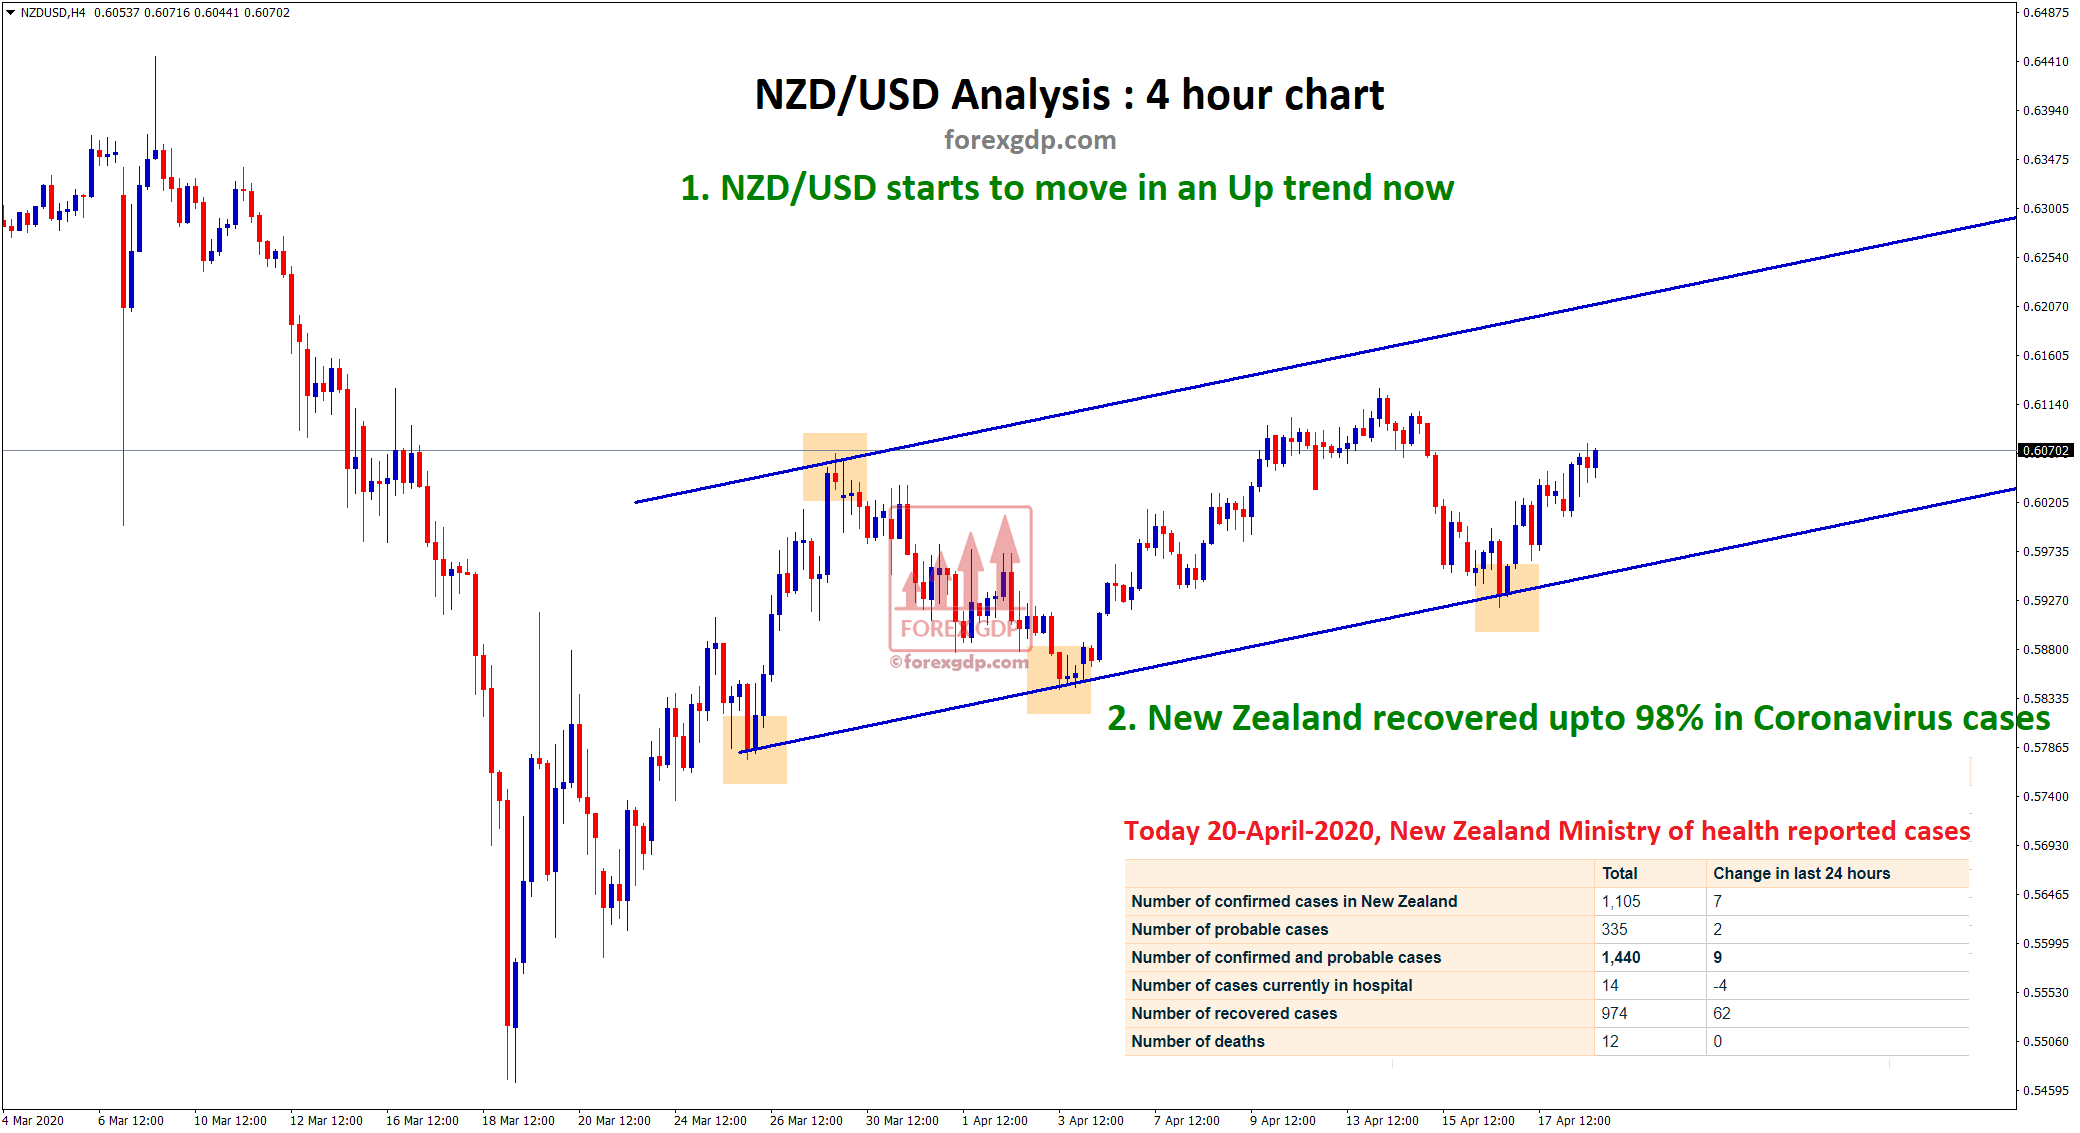
98% recovered from corona cases in NZ. NZDUSD getting strong?

NZDUSD forex forecast in 4 hour chart As per technical analysis, NZDUSD is moving in an Uptrend now and recover…
-
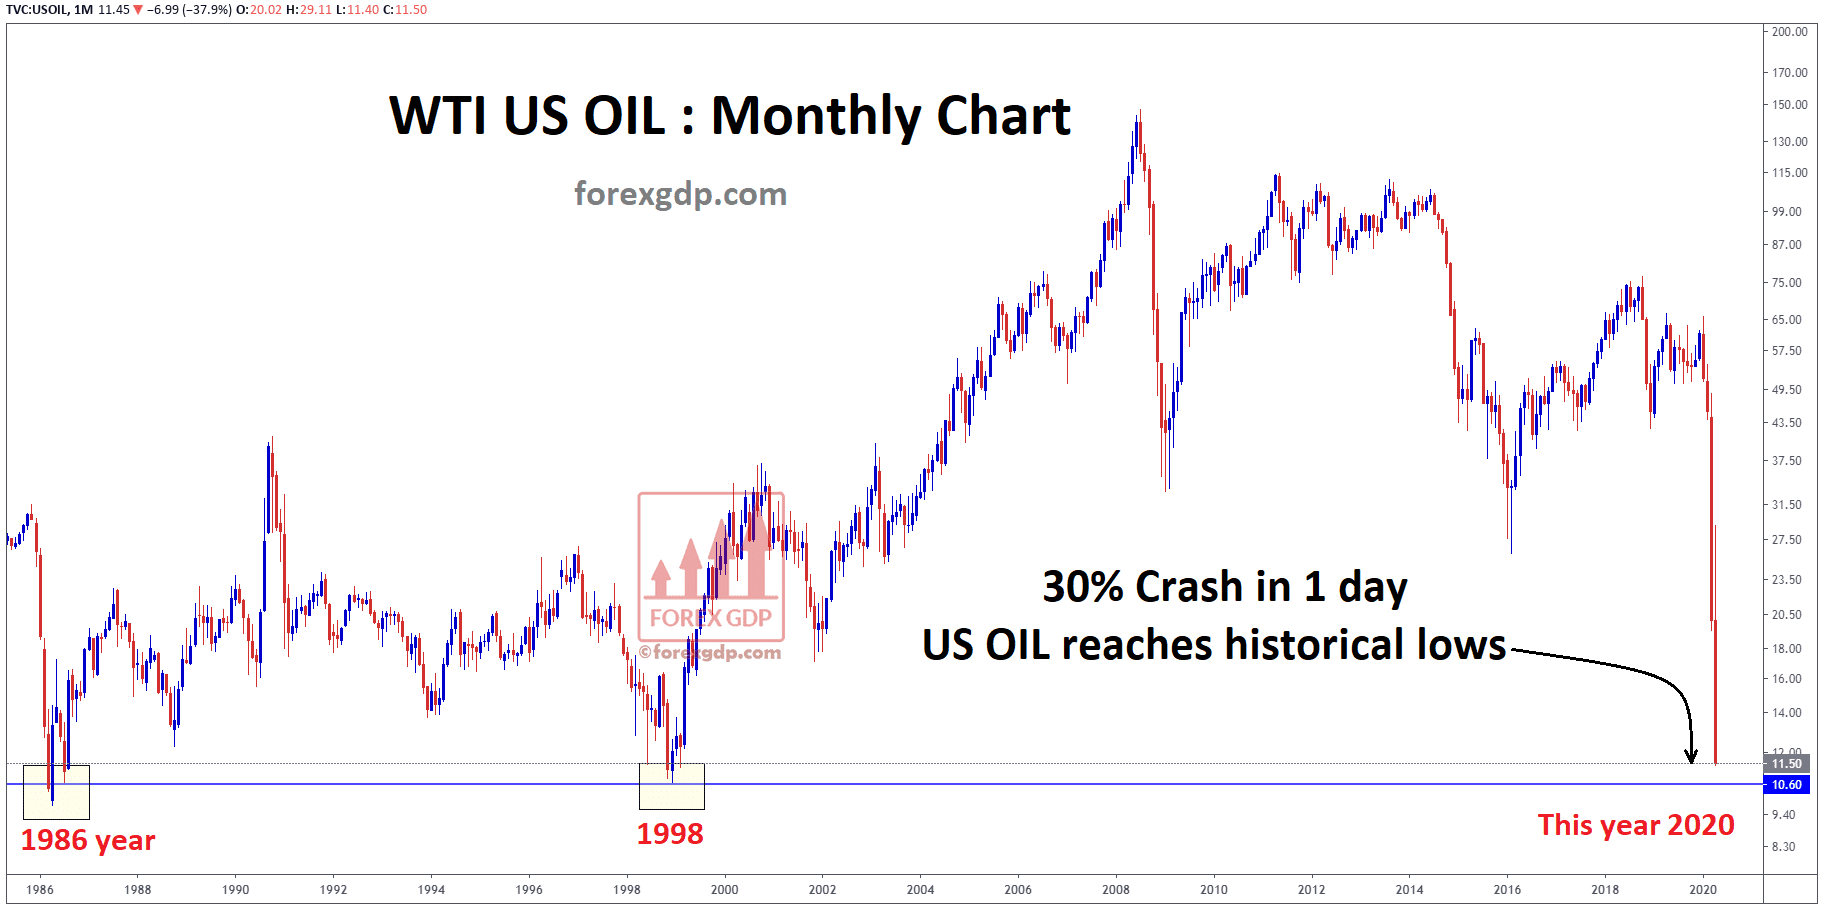
WTI Oil price hits historical low after 22 years

WTI US OIL live price fall to 11$ per barrel WTI Oil price made second big crash today on this…
-
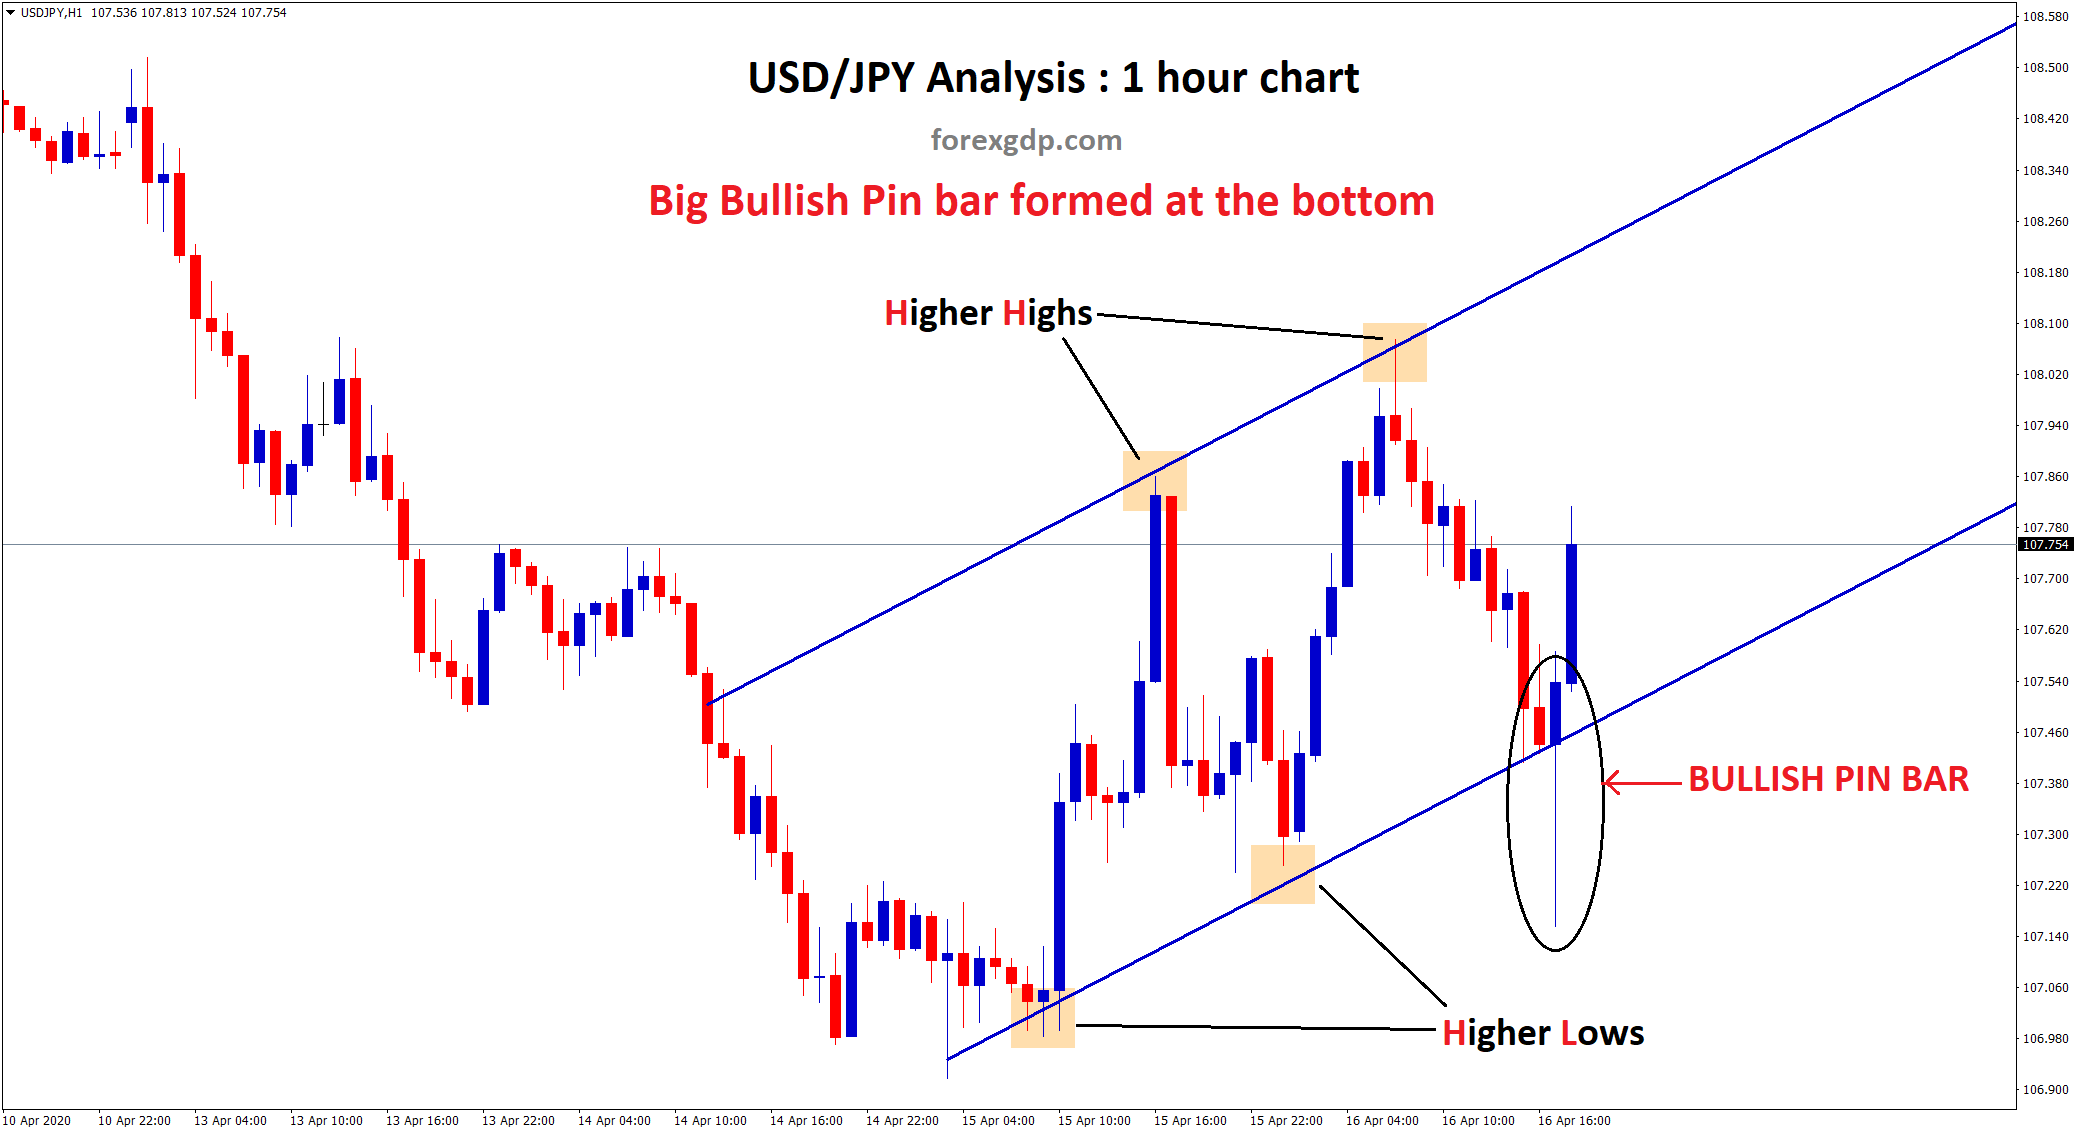
Bullish pin bar on USDJPY Support
Bullish pin bar in USDJPY up trend USDJPY bounce Up sharply by creating big reversal Bullish pin bar on 1…
-
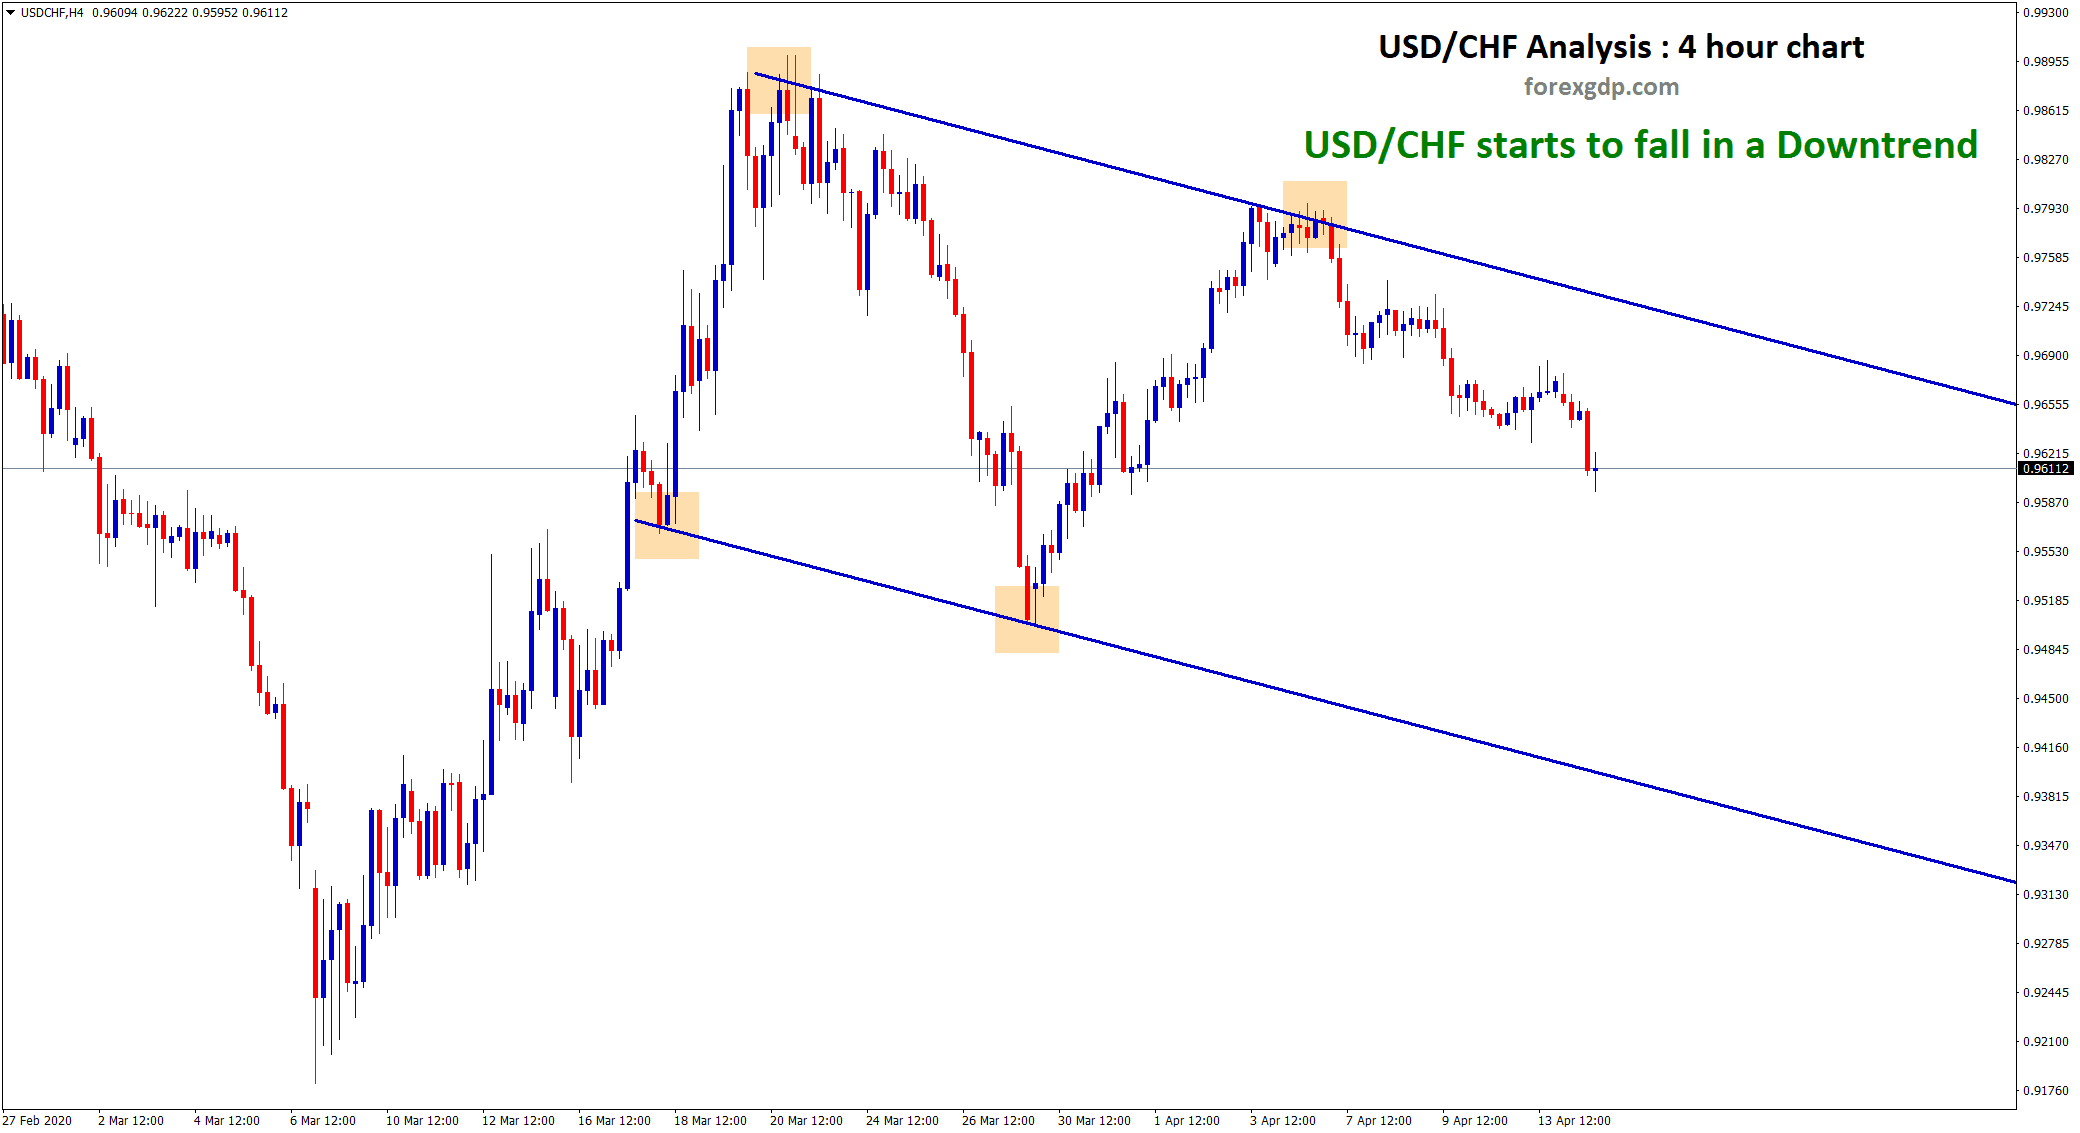
USDCHF starts to fall as USD becomes too weak due to Corona cases
USDCHF Analysis for sell trade signal United states hold No.1 Rank in Coronavirus cases and deaths (click here to see).…
-
Gold Reach New highs 1710 USD per barrel

Gold XAUUSD High Low Analysis Gold reach the new high today after 1 month. Gold made a fast recovery from…
-
Oil Price war ended, Boris Recovered from coronavirus

Oil price war - Opec secures record global oil cuts under US pressure On Sunday, Saudi Arabia and Russia Ended…
-
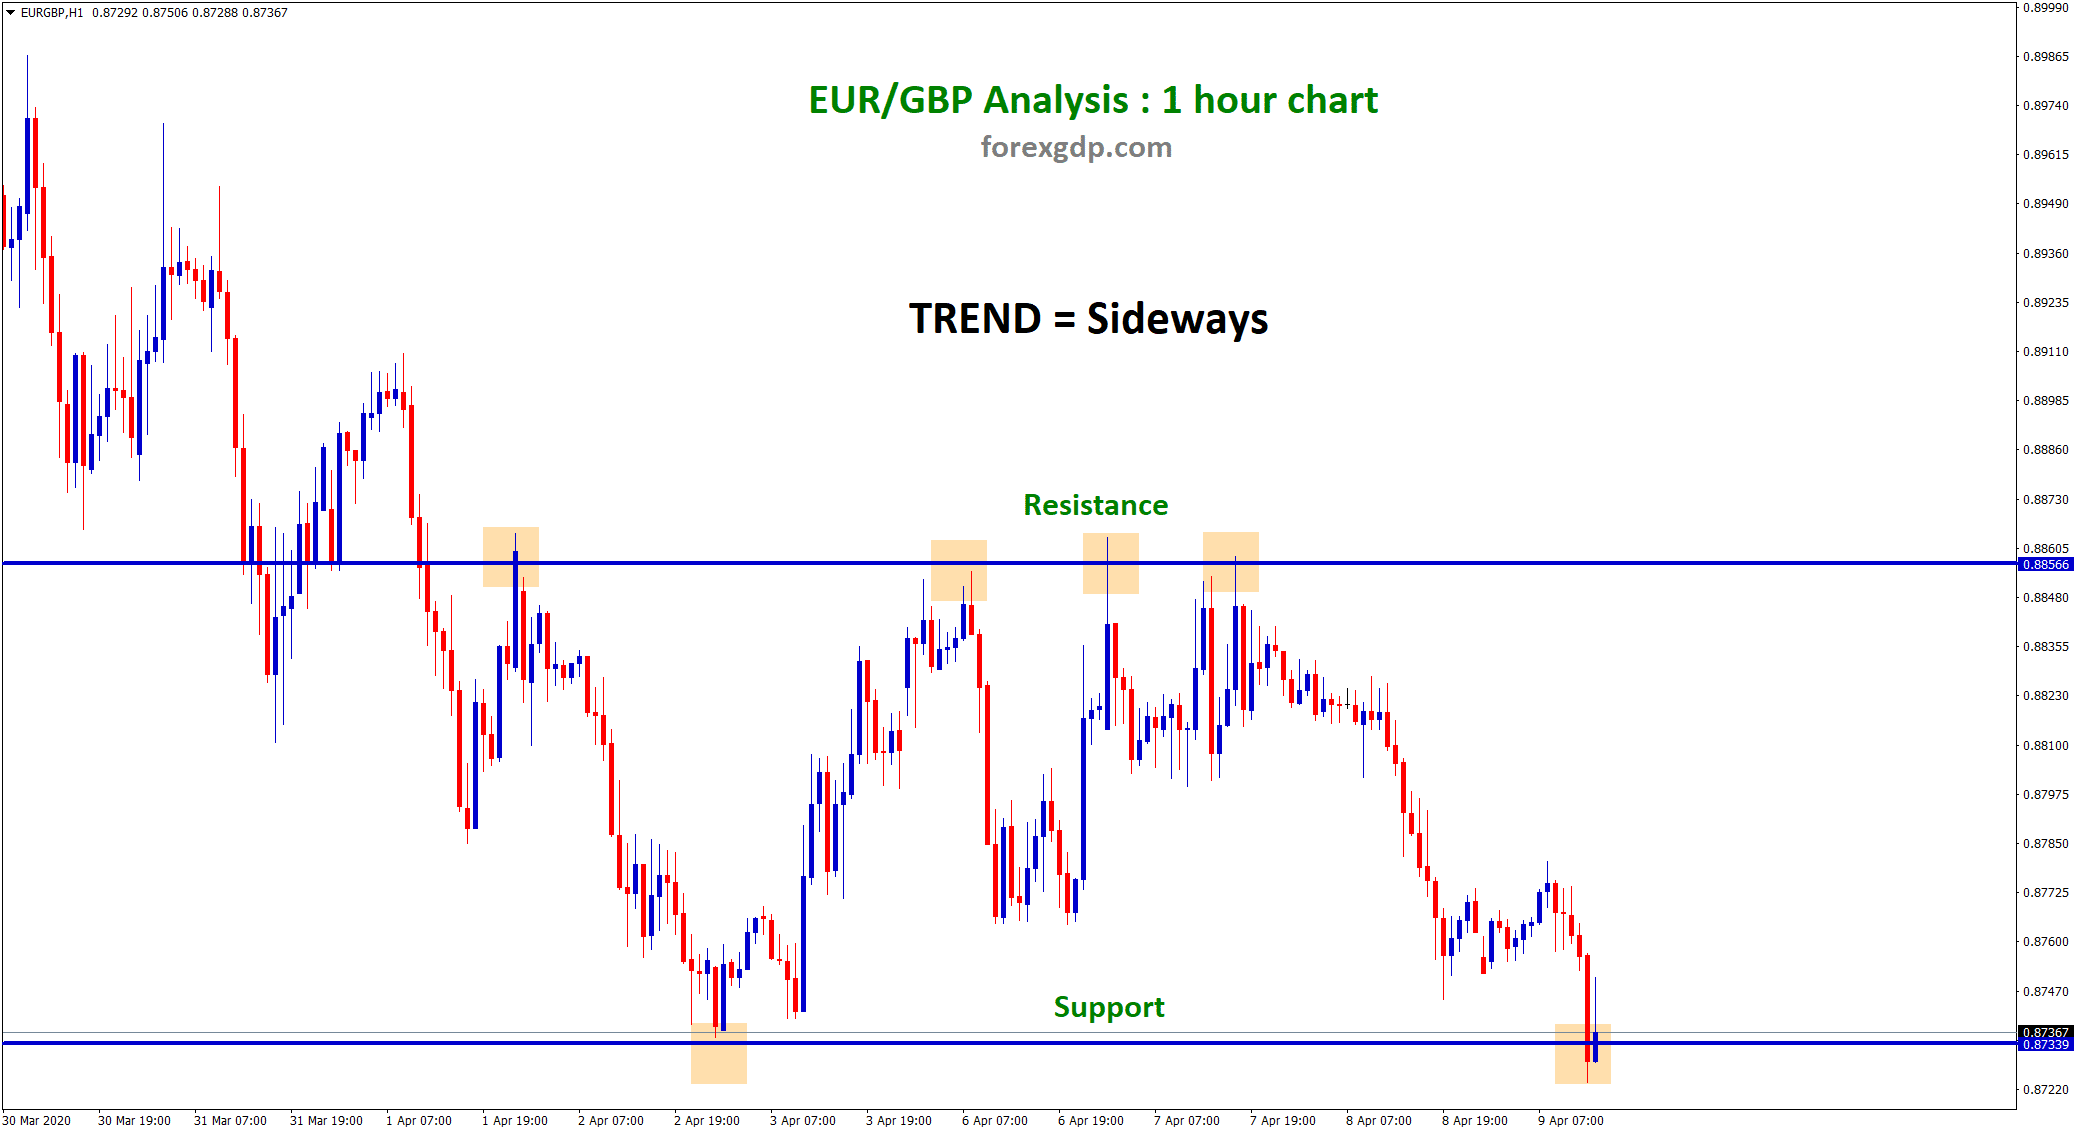
EURGBP hits the major level where reversal happened often
EURGBP moving in Sideways trend now In 1 hour chart, EURGBP moving in Sideways and now it hits the support…
-
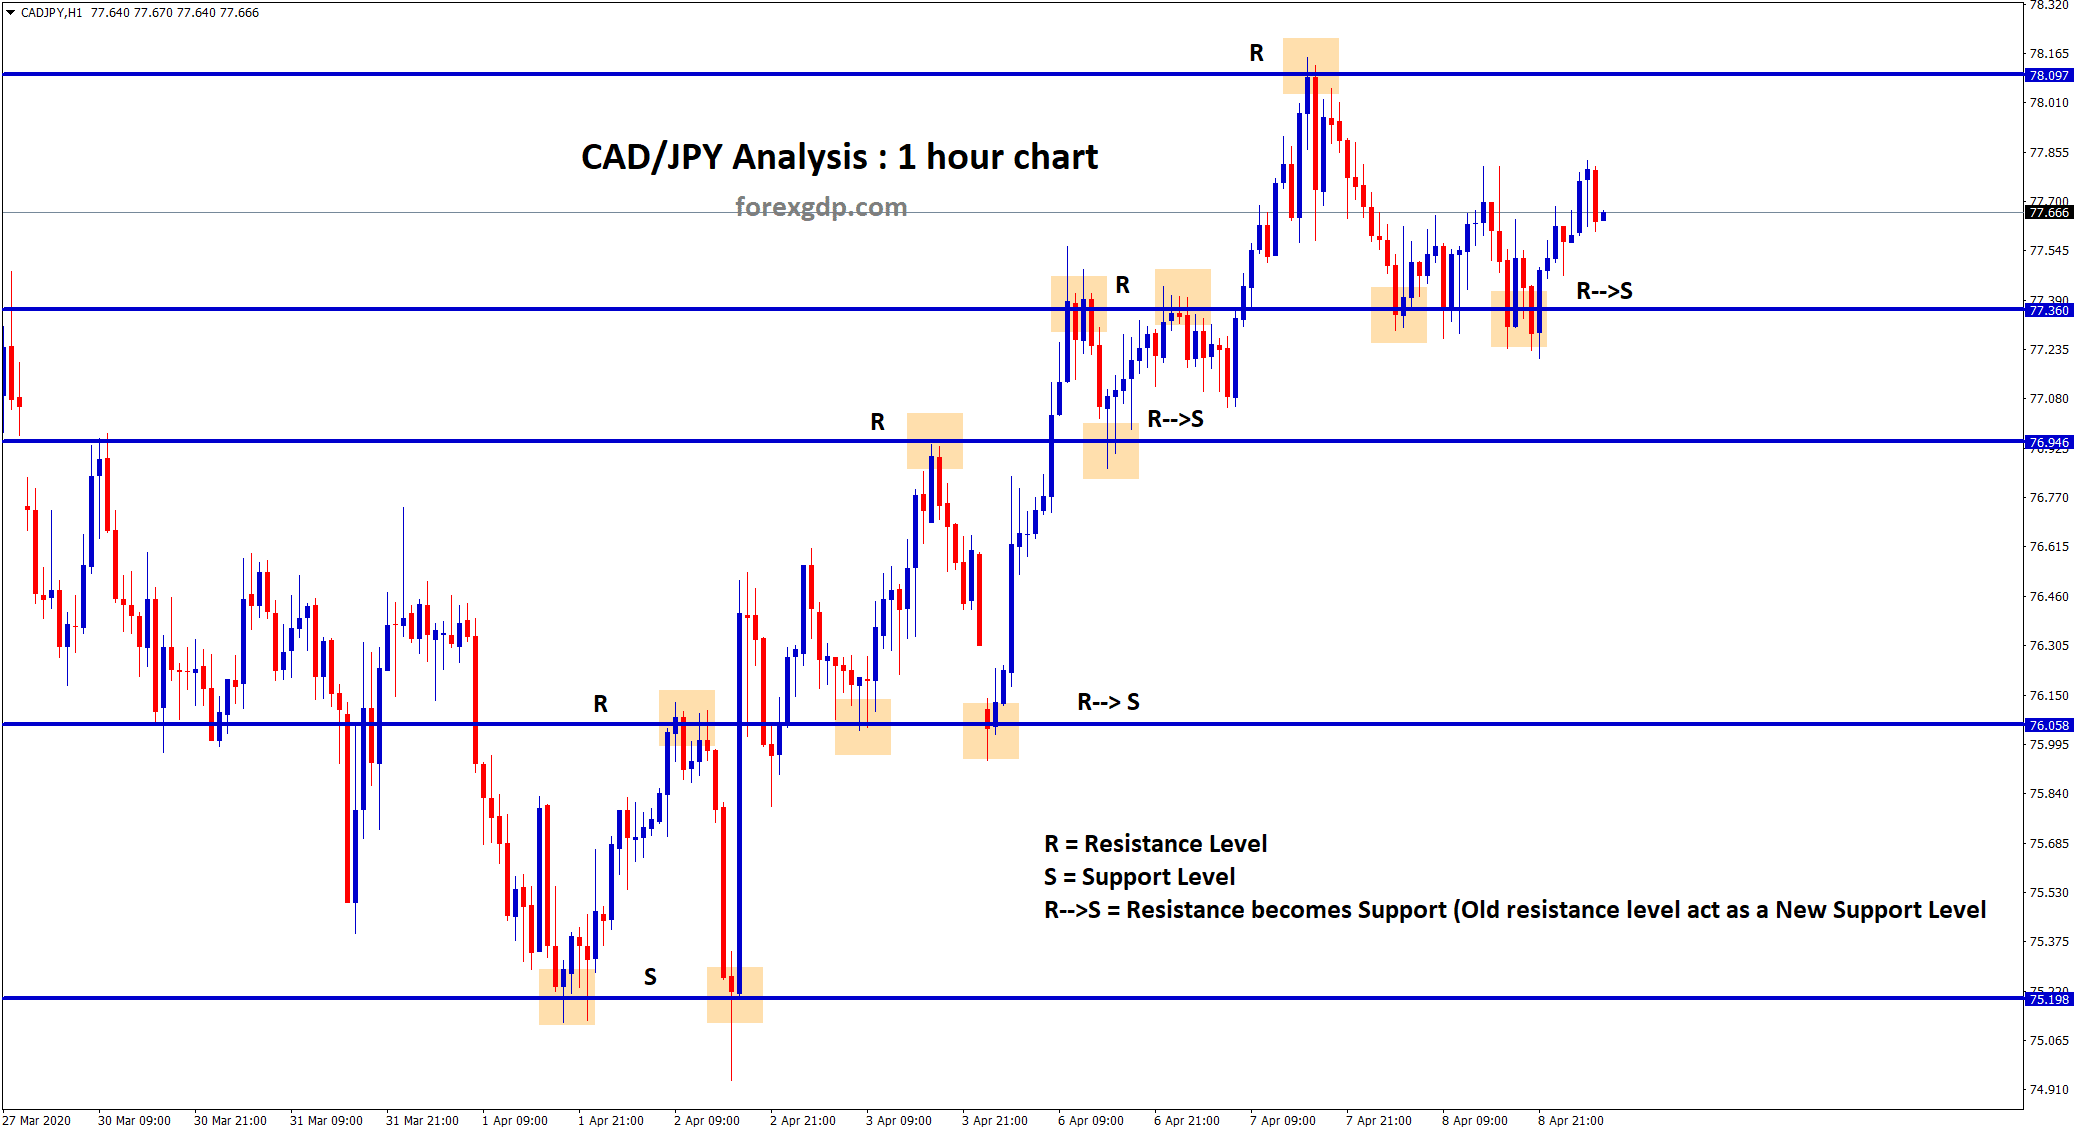
CADJPY – Old resistance acting as new support
CADJPY forex analysis in different timeframe CADJPY moving up and down by making sideways movement between the resistance and support…
-
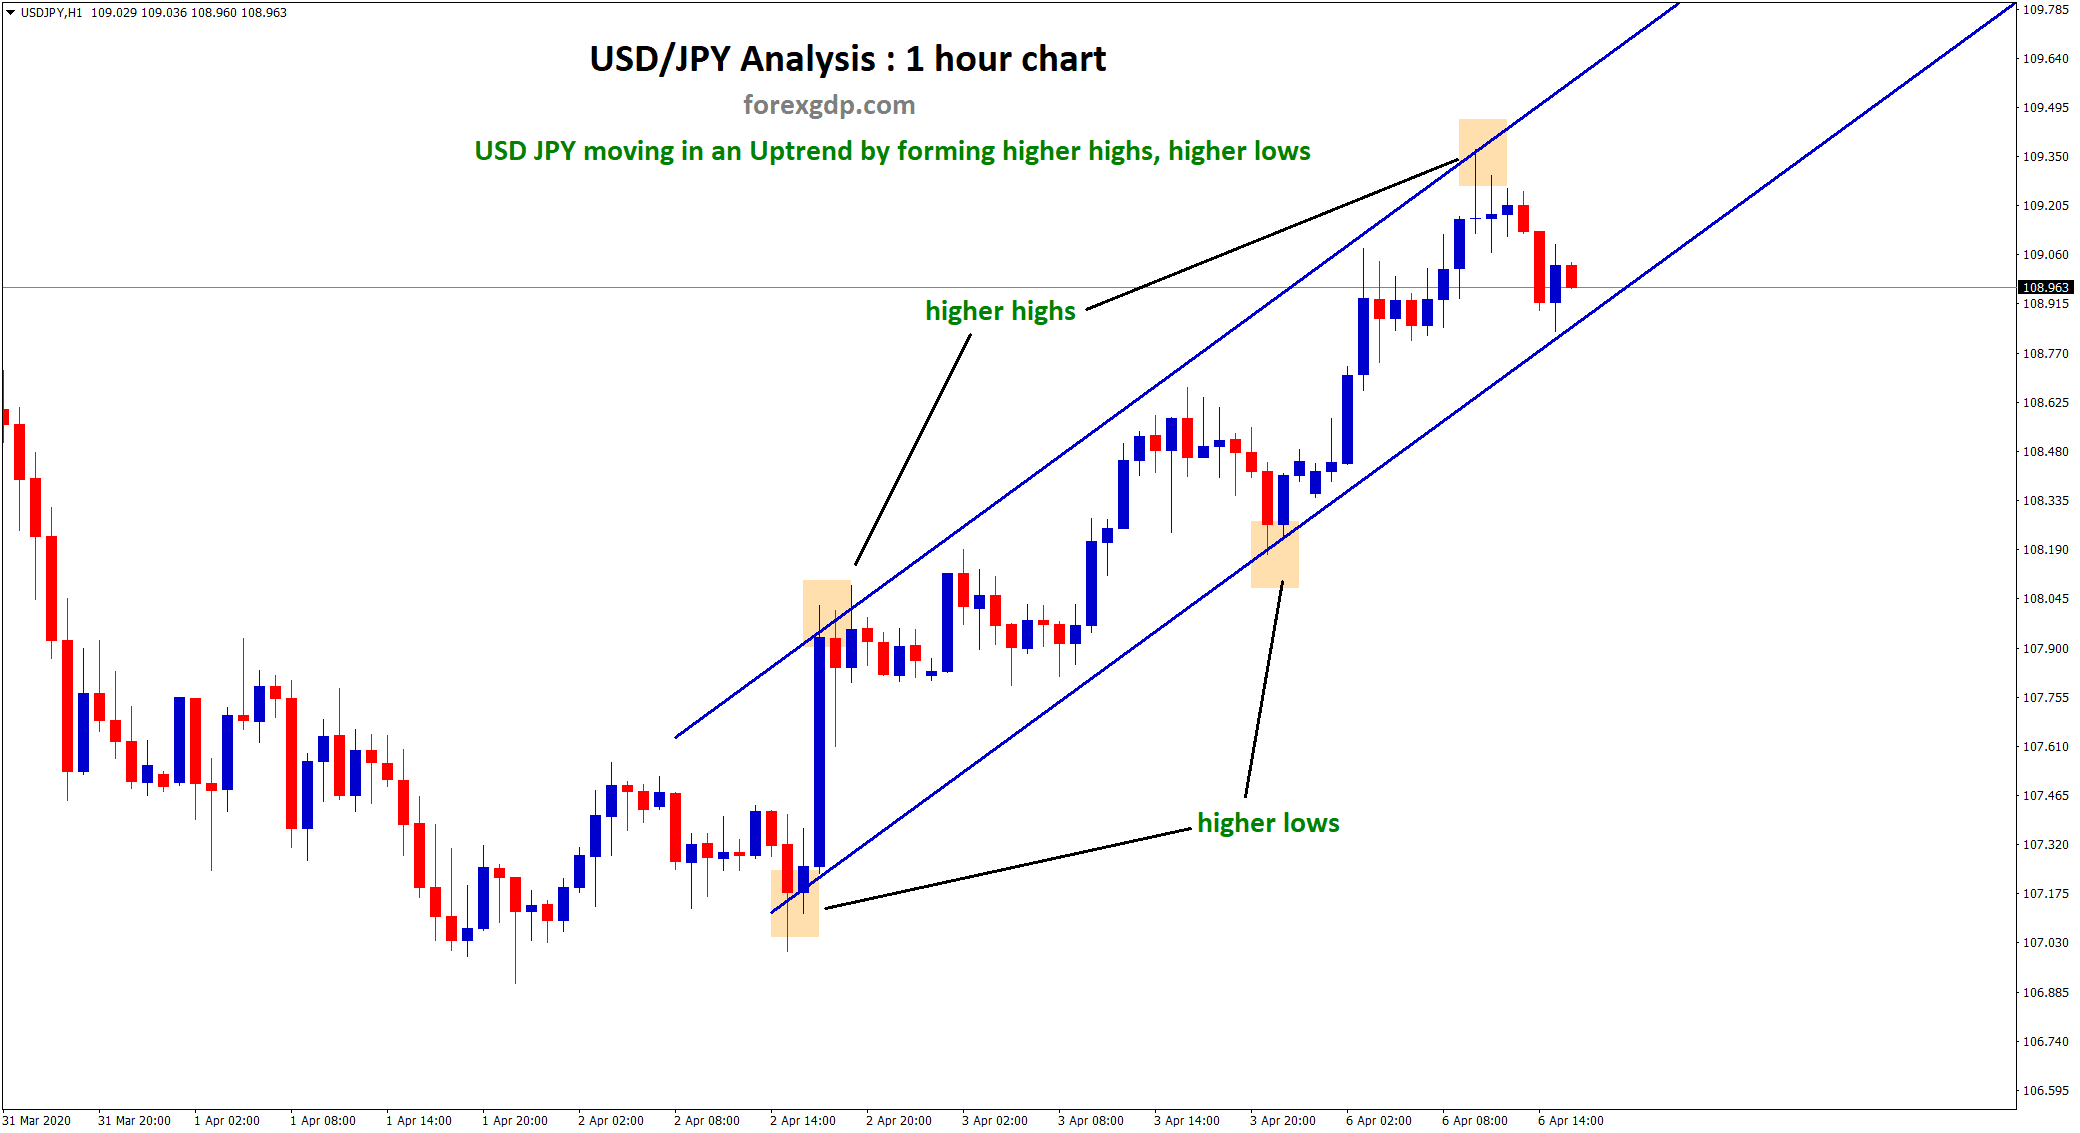
USDJPY shows “Upside” in both h4, h1 chart
Forex USDJPY Technical Chart Analysis USDJPY is moving in an Uptrend now by forming higher highs, higher lows in 1…
-
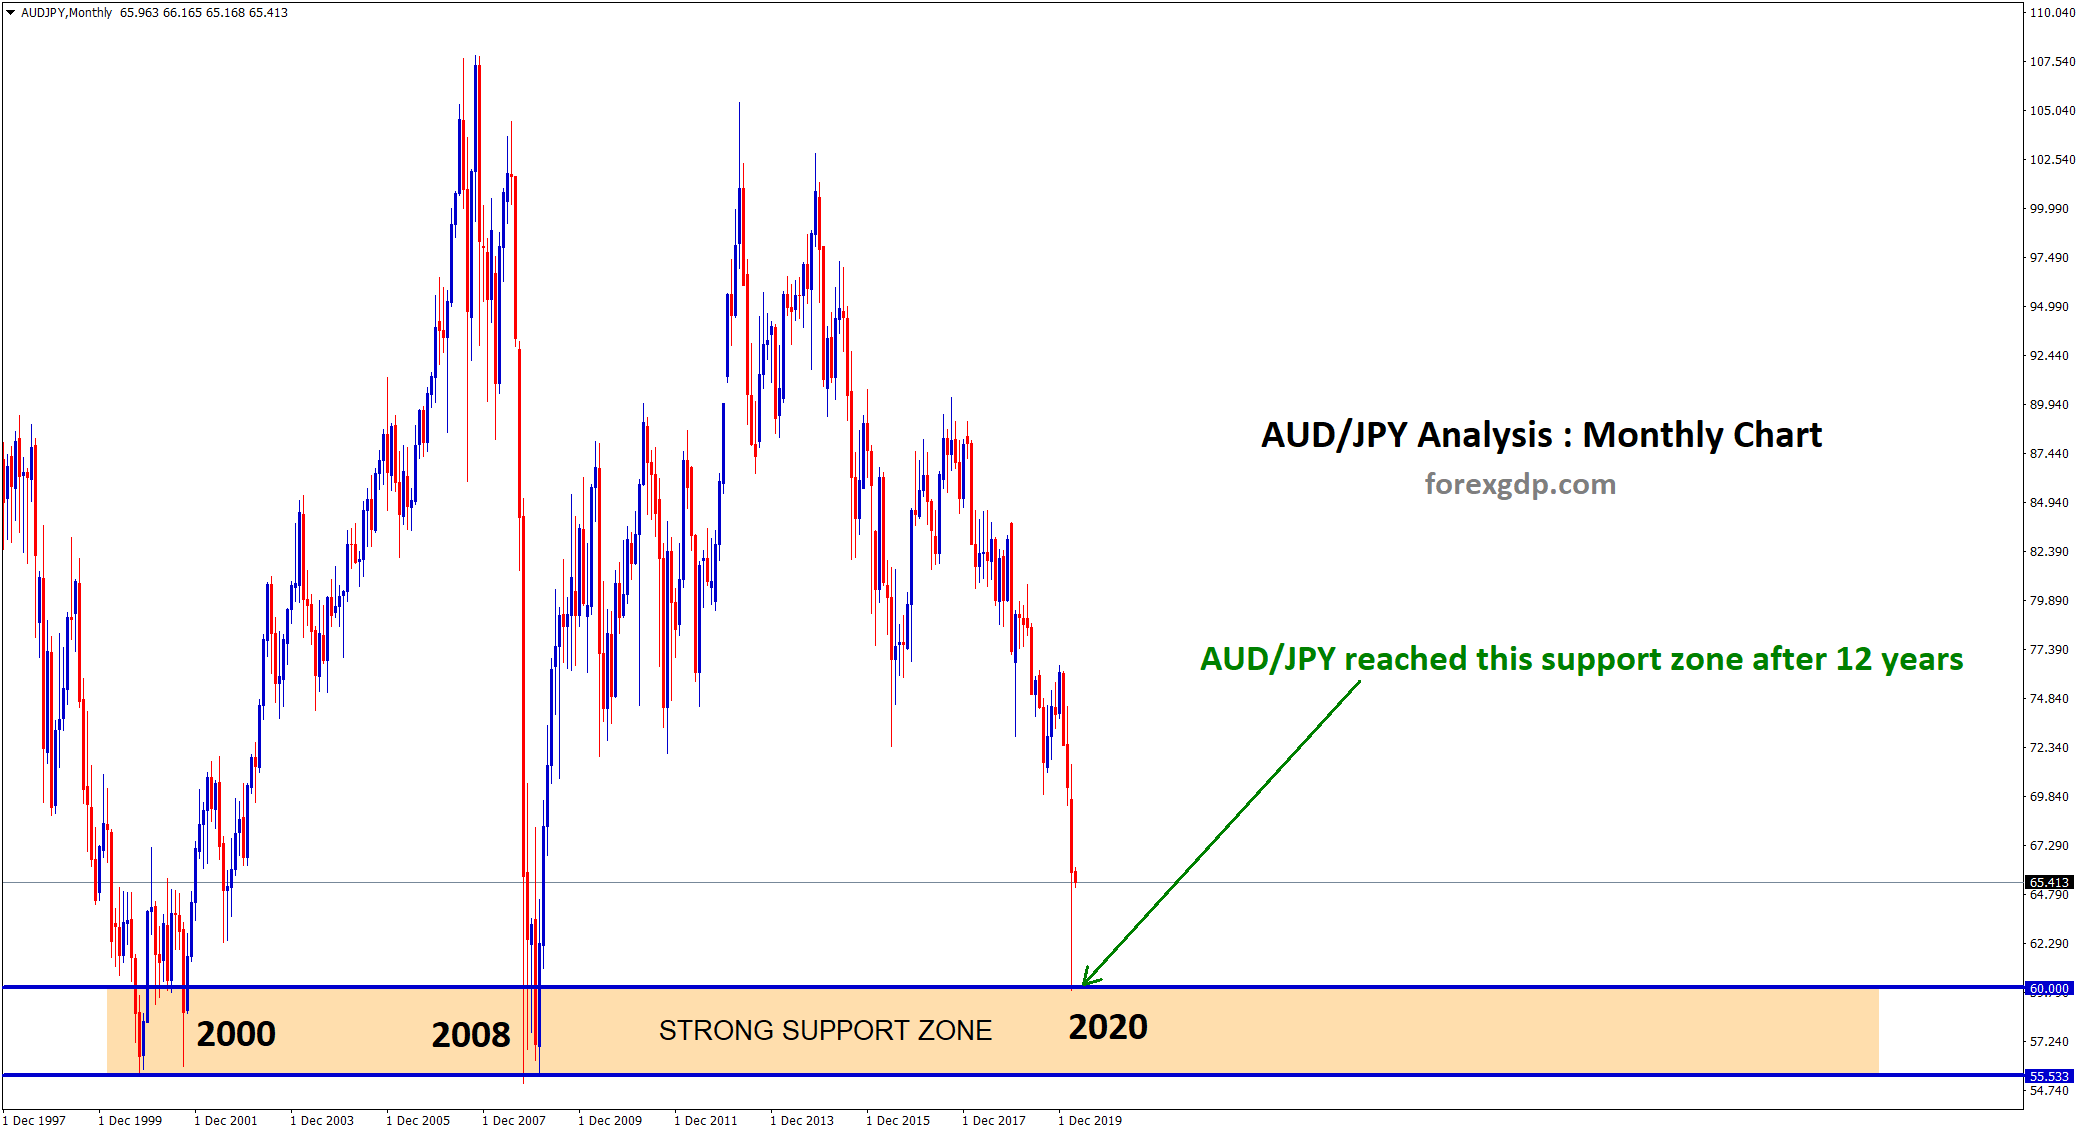
AUD JPY landed in Strong Support Zone
AUD JPY Technical trade analysis After 12 years, AUD JPY reached the strong support zone. In the year 2000, market…
-
After 18 years, crude oil hit this low price

Crude Oil Price Analysis with Technical Chart After 2002, latest analysis shows Crude oil hit this bottom price level now…
-
Free online coronavirus test to know your infection

“Coronavirus Risk Scan by Apollo hospital is designed to decrease the paranoia by generating a risk score based on your…